About
Randy Krum
President of InfoNewt.
Data Visualization and Infographic Design

Infographic Design

Infographics Design | Presentations
Consulting | Data Visualizations

DFW DataViz Meetup

Join the DFW Data Visualization and Infographics Meetup Group if you're in the Dallas/Fort Worth area!

Search the Cool Infographics site

Custom Search

Subscriptions:


Feedburner

The Cool Infographics® Gallery:

How to add the
Cool Infographics button to your:

Cool Infographics iOS icon

- iPhone
- iPad
- iPod Touch


Read on Flipboard for iPad and iPhone

Featured in the Tech & Science category

Flipboard icon

Twitter Feed
From the Bookstore

Caffeine Poster

The Caffeine Poster infographic

Entries in corporations (104)

Tuesday
Mar282017

Will Your Meeting Suck?

Will Your Meeting Suck? infographic

Are you in charge of scheduling meetings? We all know that nobody tends to like meetings. But you can use the Will Your Meeting Suck flowchart from Join Me to help schedule your next meeting. Avoid some mistakes and maybe you'll be the hero!

Take a spin through our infographic below to consider all the variables of your next meeting – time, location, snack situation – to help determine if your meeting will suck. Once you find out your risk level, you can do something about it

Decision diagrams and flow charts are good at sucking readers in to follow along the different paths.

Thanks to Don for sending in the link!

Tuesday
Nov222016

Sites Will Lose 1/3 of Sales If Not Mobile-Friendly During the Thanksgiving Weekend

You’re Going to Lose 1/3 of Your Sales If Your Website Isn’t Mobile-friendly During the Thanksgiving Weekend

Interesting analysis and data in the You’re Going to Lose 1/3 of Your Sales If Your Website Isn’t Mobile-friendly During the Thanksgiving Weekend infographic from Skilled.co

During the 2015 Thanksgiving Weekend, online stores made 43% more on average than in 2014. Almost 50% of traffic came from mobile devices while one third of sales was made on smartphones. This year, the mobile traffic is predicted to grow to 57% and the smartphones are going to cut even bigger portion of online sales.

The infographic does a good job of walking the reader through a sequential series of data points and predictions for the 2016 Black Friday weekend sales. Clean visuals, except for the doughnut charts that show sections in random order. Pir charts and doughnut charts should start at 12 o'clock or 0° and sequence the data in descending order in a clockwise direction.

I think the title is too long, and misleading as well. It implies that a company's sales will drop by 33% if their site isn't mobile-friendly, but based on the data they share, you can see that sales through desktop computers continues to rise as well. It might be better to say that a company may miss out on additional sales without a solid mobile purchasing experience. The prediction also ignores that sales through a company's mobile app may offset the risk of having a non-mobile-friendly website.

Thursday
Sep292016

Visualizing the Fortune 500

Visualizing the Fortune 500 interactive data visualization

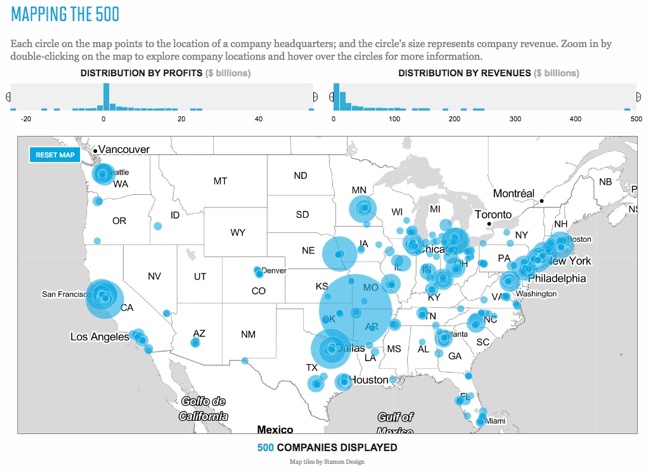
Visualizing the Fortune 500 is an experiment by the team at Fortune magazine. This is an interactive data visualization site that shows the location of each company's headquarters and the size of the circle represents the company's annual revenue.

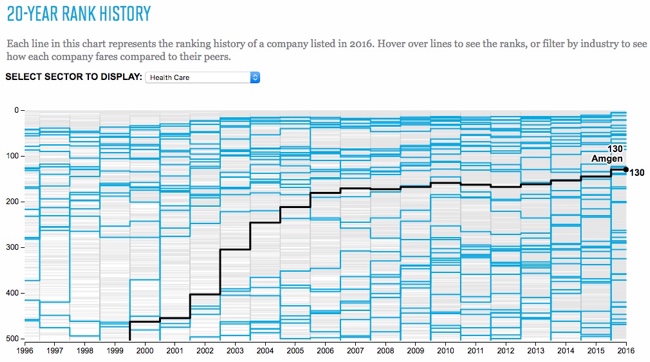
People visit and revisit the Fortune 500 for lots of reasons, chief among them: job prospects, sales leads, corporate research and investor information. And bragging rights, of course. Below are two visualizations that allow you to explore the Fortune 500. On the map you'll find every one of the U.S. headquarters from the 2016 list, on the line chart below it, you'll see how each of the companies on the 2016 list has moved through the ranks for the past 20 years.

They also show an interactive visualization of how the companies have moved through the ranks over the last 20 year history of the Fortune 500.

Designed by Nicolas Rapp, using map tiles from Stamen Design.

Wednesday
Dec022015

10 Things You Need to Know About Logo Design

10 Things You Need to Know About Logo Design infographic

Logos are more than just a stamp on a page, they embody the whole meaning behind your product. The 10 Things You Need to Know About Logo Design infographic from Blue Soda Promo wants to make sure that you make the best decision when choosing your design.

“People are more likely to remember the company logo, an illustration representing the company, than the actual name of the company. When it comes to purchase decisions, consumers are more likely to buy products from familiar companies. When buyers are in a store looking at products on the shelf, they are more likely to choose the products from companies they recognize, and logos are more likely to be remembered. Companies know this, and are very careful to design their product packaging to clearly show the company or brand logo.”

*Excerpt From: Randy Krum. “Cool Infographics.” - bit.ly/CoolInfoBook

There is a nice comical feeling to the infographic that is consistent throughout. It is good to keep consistency when designing all parts of an infographic.

Nike’s swoosh, McDonalds’s golden’s arches, and Apple’s bitten fruit all have one thing in common…

Well, that’s not exactly true as you’ll find out later in this post.

However! What they do share is the overarching success their logos have had on the world. People no longer need to be told what their logos represent. When their logos are stamped on something they have certain consumer expectations attached to it. Their logos became their own company’s spokespeople, while their products continue to prove their worth.

Examples are key for this kind of topic. People will understand the importance of the points better when the examples are clear and easy to recognize. It also helps reinforce the idea that a logo embodies the personality of the company. When the author changes one of the logos we are familiar with, it just doesn't feel right!

Thanks to Matt for sending in the link!

Tuesday
Jul282015

Largest Company by Revenue in Each State 2015

Largest Company by Revenue in Each State 2015 map

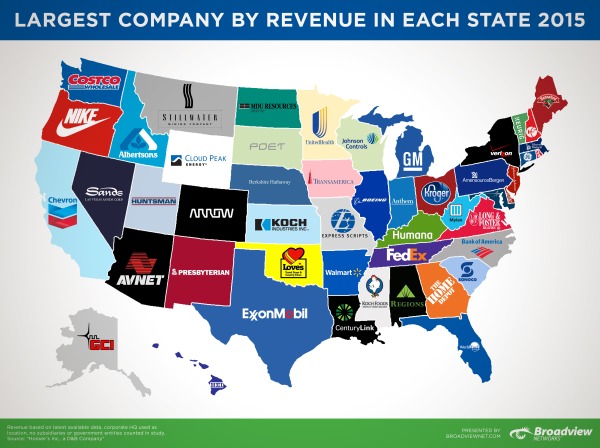
The Largest Company by Revenue in Each State 2015 map was created by Broadview Networks by using Hoover’s, a D&B Company's data. Even though there might be "bigger" companies in each state than the ones represented, the map is specifically looking at the greatest amount of revenue from the 2015 financial year.

You may have seen the Largest Companies by Revenue map we put together in June of last year, well we’re back with an updated version using Hoover’s 2015 data.  Last year’s map created so much buzz and insightful conversation that we deemed it essential to find out how it’s changed over the past year.  Using Hoover’s, a D&B Company, we searched through each state’s list of companies to find which had the largest revenue in the last fiscal year.  It was interesting to see how each company’s revenues have changed over the year (for better or worse) and to see if a new largest company had emerged.

At first glance, you may ask, “Where are Apple and Microsoft?”  Yes, these are huge companies but this map is specifically looking at total revenue from the last fiscal year.  If we look at California with Apple vs. Chevron, there is a large discrepancy between market value and total revenues.  Apple’s market value as of March 31, 2015 was $724 billion while Chevron’s was only (and we use “only” lightly) $197 billion.  In terms of revenue, Chevron comes out on top with $203 billion in the last fiscal year while Apple had revenues of $182 billion.

Please note: We used Hoover’s company database as our source, not the most recent Fortune 500 list.  Location and state are based on the corporate headquarters of that company, no branches or foreign offices.  Lastly, we decided not to include any subsidiaries or government entities for the sake of staying consistent.

I liked how they didn't manipulate the US map. Manipulation would have taken the focus away from the company's logos. If you click on the infographic, the original allows you to zoom in close enough to comfortably see small states, like CVS is Rhode Island's largest company of 2015. This infographic could of easily been overworked but instead they kept it simple.

The company post inspired a lot of discussion about the data, and I think that was part of the purpose behind the design. Is this the best data to show? Where are some of the more recognizable companies? There's even at least one error in the map.

Found on Broadview Networks VoIP Blog

Wednesday
Feb252015

Five Innovative Ways Companies Are Using Infographics to Share Data

The popularity of turning data into visuals has skyrocketed in recent years. Especially the keyword “infographic,” as evidenced through Google Trends. This has sent capable marketers scrambling for a competent team of: designers, copywriters, and producers to create new and exciting content. While charts and graphs are nothing new, the way they are displayed visually (and the stories they can tell), is expanding into uncharted waters.
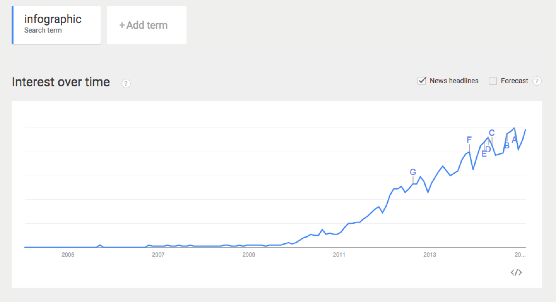
via: Google Trends - “Infographic”

Infographics and data visualizations were once the playthings of academics. Beautiful displays of information were created and tucked away in their ivory towers of academia. Those days are now long over, and the power of data combined with visual information has been passed on to the masses.

For a while, it seemed nearly everyone under the sun was creating infographics. This resulted in an over-saturation of infographics online, with marketers cranking them out as fast as possible. Complete with often poor designs, and misleading data.

While this over-saturation did hurt the online marketing reputation of infographics slightly, their growth in online popularity did not. This online exposure and awareness of infographics has driven a significant increase in the use of infographics inside companies as well.

To help clear the air, check out these six examples below for how companies are coming up with innovative ways to use infographics.  


1. Hotels.com: PR Infographics
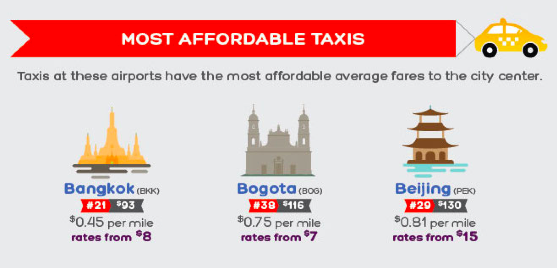
Traveling and flying to new cities can be equal parts exciting and terrifying. This infographic from Hotels.com, provides travelers with valuable insights they should know before arriving in major cities around the world. This infographic is great because it gives their customers valuable information (and saves a bit of decision-making time) to make their transition from the sky to the city that much smoother.

Another great thing about these infographics is that they are specifically targeting the press with their proprietary internal data. This builds their credibility by sharing their expertise and valuable insight into the hotel industry. They’re not just telling the press, they’re showing them the data visually as well.


2. Wine Folly: Food and Wine Pairing
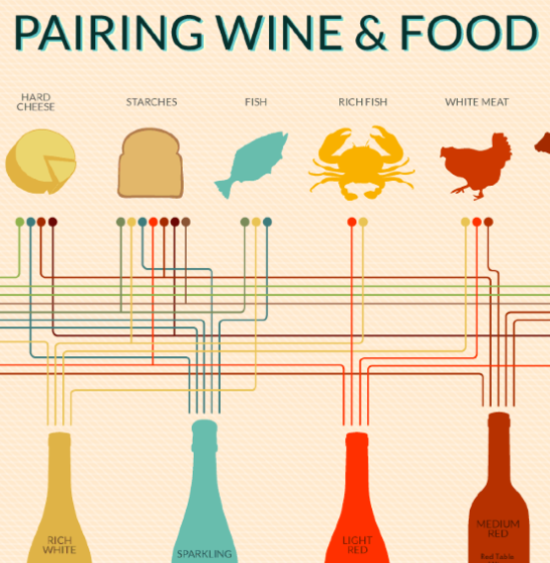
This infographic from Wine Folly looks at all the different taste profiles, such as sweet and sour, to create the perfect food and wine pairings. The great thing about this infographic is its online life span - which can easily last for many years. Twenty years from now, the information will still be the same, and the design will still be relevant to readers.

Online lifespan can make a huge difference to the ongoing SEO value of any infographic, and should be an integral part of the topic selection process.


3. SumAll: The Internet is a Zoo - The Ideal Length of Everything Online
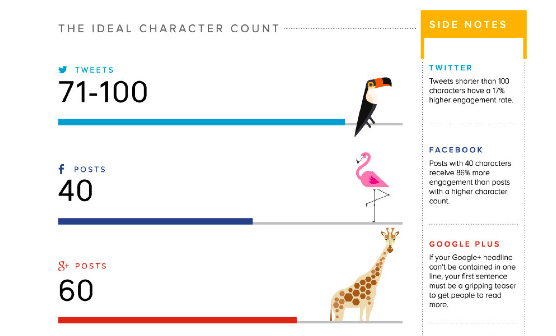
This infographic from SumAll looks at something we all struggle with: our attention spans. How many characters long should a Facebook post be? What is the ideal subject line length? How many words should a blog post be so that it actually gets read? All the answers to your burning questions are here in one place. 

What makes this graphic so good is that these observations apply to all social media audiences, no matter what industry they come from. It’s a valuable topic for marketers in any industry.


4. Warby Parker Annual Report
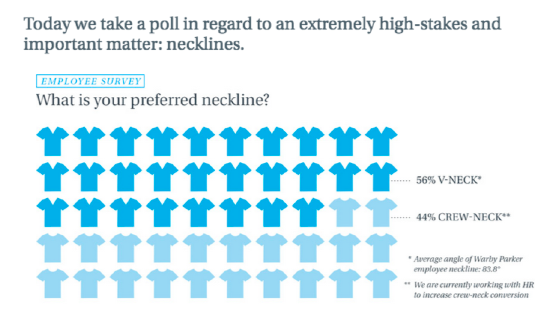
The annual report is getting a strong makeover thanks to innovative companies like Warby Parker. The annual report used to be a non-event. Everyone made an annual report, and they all basically looked and felt the same; i.e. lots of words, mixed in with some charts and graphs. Warby Parker really hit the mark with their 2013 Annual Report

In an article on Business Insider, they explain how Warby Parker’s previous two annual reports fit into it’s quirky brand, but the 2013 annual report is it’s most ambitious. It may seem like it has plenty of meaningless information, but it’s a smart business move. Because amidst all of the meaningless information, you begin to realize that it’s not actually an annual report at all, but a giant advertisement intended to become viral. This resulted in some of their biggest sales days.

Seeing as how every business loves talking about itself on social media, it’s surprising it has taken this long for the annual report to become relevant again.


5. MHPM Corporate Sustainability Report
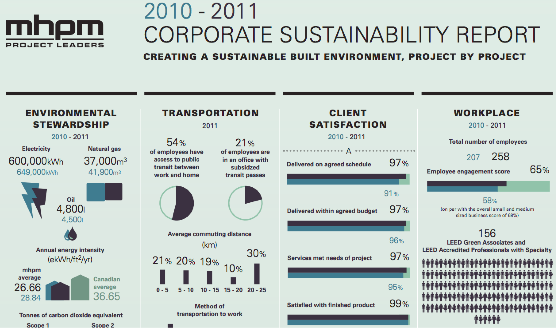
This infographic from MHPM examines the creation of a sustainably built environment, project by project. More and more, sustainability matters to clients, employees and the communities they all live and work in. With the right practices in place, a sustainable building is worth more (and costs less to operate) than traditional buildings, helping to make them an attractive choice versus competitors.

This new application of infographics lets MHPH tell their own story in a visually appealing way. By providing the numbers behind their commitment to keeping their projects green, MHPM has not only helped prove their own claim that Sustainability is Free™, but they also share how they can help their customers.

As we have seen over recent years, infographics have continued to grow in popularity. Giving rise to a new Internet, continually heading in the direction of displaying more advanced, and beautiful ways to visualize information. What are some other creative uses of infographics you have seen lately?

Thursday
Jan292015

The Salesforce Economy

The Salesforce Economy infographic

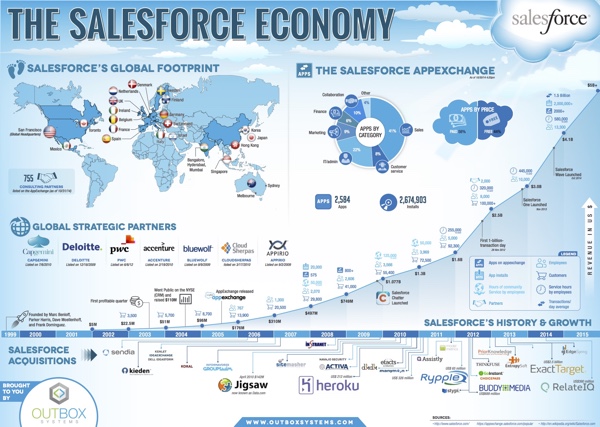
The Salesforce Economy infographic created by Outbox Systems is an overview of where the company is today and a little history on how it came to be.

Salesforce is a global powerhouse.  This infographic displays the Salesforce economy, including the company’s growth, global reach, timeline and more.

This design is a great visual summary of the corporate history of Salesforce. Revenue growth, global presence, acquisitions, strategic partners and an overview of apps. EDIT: You can download the high-resolution PDF version on their landing page.

The overall design is pushing the Fair Use of the Salesforce trademark pretty far. One of the trademark infringement tests is the “possibility for confusion”, and I wouldn’t be surprised if some readers walk away thinking this is an official infographic put out by Salesforce instead of Outbox.

Thanks to Darren for sending in the link!

Friday
Jul052013

The Conversation Prism 4.0 for 2013

The Conversation Prism 4.0 for 2013 infographic

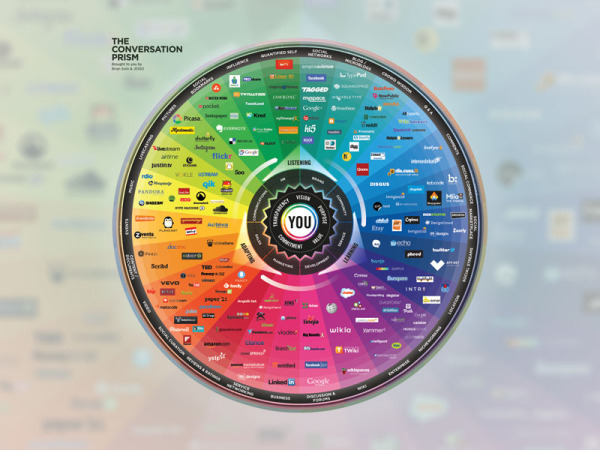
Brian Solis has released the new Conversation Prism 4.0, with updated companies and categories for 2013.  This project series has been a favorite on Cool Infographics since version 1.0 was released in 2008, and we haven’t seen an update since version 3.0 was released in 2010.

What is The Conversation Prism?

Developed in 2008 by Brian Solis, The Conversation Prism is a visual map of the social media landscape. It’s an ongoing study in digital ethnography that tracks dominant and promising social networks and organizes them by how they’re used in everyday life.

Version 4.0 brings about some of the most significant changes since the beginning. In this round, we moved away from the flower-like motif to simplify and focus the landscape. With all of the changes in social media, it would have been easier to expand the lens. Instead, we narrowed the view to focus on those that are on a path to mainstream understanding or acceptance. The result was the removal of 122 services while only adding 111. This introduces an opportunity for a series of industry or vertical-specific Prisms to be introduced so stay tuned.

The Conversation Prism 4.0 for 2013 closeup

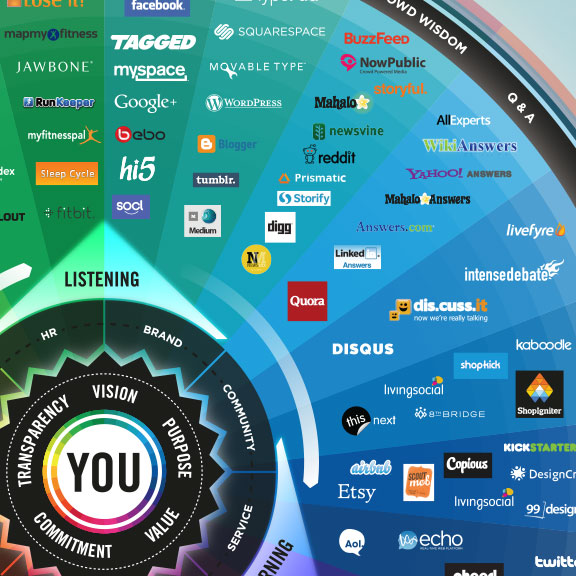
The design highlights the major companies in 26 different categories of social networking services.  This update loses the flower-like design style of the last three versions, and changes to a more straightforward circle with equal sized pie slices.

The inner circles have always been a little confusing for readers and marketers because the intent is that the inner labels can be adjusted depending on the user.  They don’t necessarily relate specifically to the services they are located near in the outer slices.

As a snapshot of the current social media landscape, this is a fantastic tool for marketers to consider the tools and services they want to engage for any particular campaign.  Three years was too long to wait for an update, since this landscape is changing and evolving very quickly.  That’s why 122 individual services were removed and 111 services were added. 

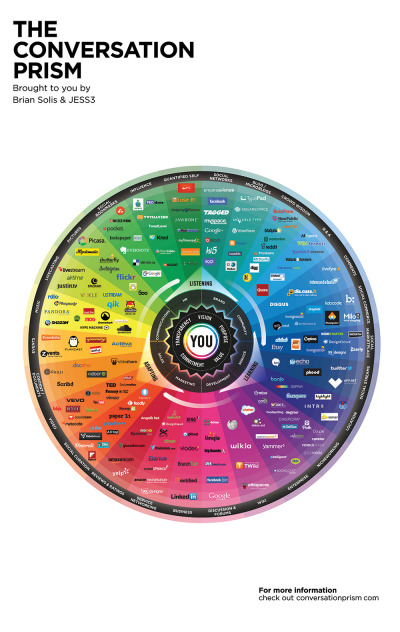
The Conversation Prism 4.0 for 2013 poster

The Conversation Prism 4.0 is available as a free high resolution JPG image download (great for computer wallpaper/desktop) of for purchase as a 22”x28” wall poster for $19.

Thanks to Jarred for sending in the link!  Also found on Mashable and The Next Web.


Tuesday
Apr162013

The Anatomy of the Social Media Command Center

The Anatomy of the Social Media Command Center infographic

Beingyourbrand.com has created The Anatomy of the Social Media Command Center so that you can learn more about a few of their favorite social media command centers, and how to construct your own.

In the recent months, many major brands have developed what they are calling “Social Media Command Centers.” These centers are state-of-the-art listening hubs that allow brands to monitor their presence on major social platforms and be ultra-responsive to conversations happening about their company. However, with all their glamor, are these command centers really capable of delivering results, or are they just for show?

The following infographic, looks at three of the most noteworthy examples of social media command centers:

  • The University of Oregon’s Quakecave in Autzen stadium
  • Gatorade’s Mission Control at their Chicago headquarters, featuring custom visualization from STRUCKUndercurrent, and Radian6
  • The American Red Cross Command Center powered by Dell

More of a visual explanation, the design does share some common points of data like number of employees and a relative scale of the amount of data being collected.  It’s a good design that clearly explains this new marketing function to readers.

The URL link to the infographic landing page on the should have been included in the footer to help readers find the original full-size version when the infographic is shared on other sites (like this one).  Especially a good idea since this was posted on their blog, and will get buried in the archive over time.

Thanks to Matt for sending in the link!

Wednesday
Apr102013

How Corporate Logos Evolve

How Corporate Logos Evolve infographic

How Corporate Logos Evolve, from The Logo Company, shows us how even iconic world-wide recognized company logos change over time.

We often get asked for a logo design that can stand the test of time. Something that will last forever. I mean, we look at all these “Mega Corporates” and their logos never change. Do they? Well, actually and surprisingly, they do….a lot.

This illustration depicts some of the biggest global brands and highlights the evolution of their logos from humble beginnings to the present day. It might strike you how some of the designs started out looking like their biggest rivals and others appear to of hardly changed at all. Timeless is certainly not the overriding characteristic of most of these early creations.

This is a perfect use of an informative infographic that ties directly into a company’s business, and makes for a great content tool for marketing.  The big challenge in the coming years will be the relevance of infographics to the sites that publish them, and this is the right way to do it.  Informative, entertaining infographic that is directly relevant to the hosting website without specifically being an advertisement for their business.

They should have included a copyright (or Creative Commons) license and the direct URL to the infographic blog post in the footer of the design.  That way the information travels with the infographic as it is shared and posted across different sites.

Found on Best Infographics