About
Randy Krum
President of InfoNewt.
Data Visualization and Infographic Design

Infographic Design

Infographics Design | Presentations
Consulting | Data Visualizations

DFW DataViz Meetup

Join the DFW Data Visualization and Infographics Meetup Group if you're in the Dallas/Fort Worth area!

Search the Cool Infographics site

Custom Search

Subscriptions:


Feedburner

The Cool Infographics® Gallery:

How to add the
Cool Infographics button to your:

Cool Infographics iOS icon

- iPhone
- iPad
- iPod Touch


Read on Flipboard for iPad and iPhone

Featured in the Tech & Science category

Flipboard icon

Twitter Feed
From the Bookstore

Caffeine Poster

The Caffeine Poster infographic

Entries in brands (8)

Monday
Nov272017

These 5 Giant Companies Control the World's Beer

These 5 Giant Companies Control the World's Beer infographic

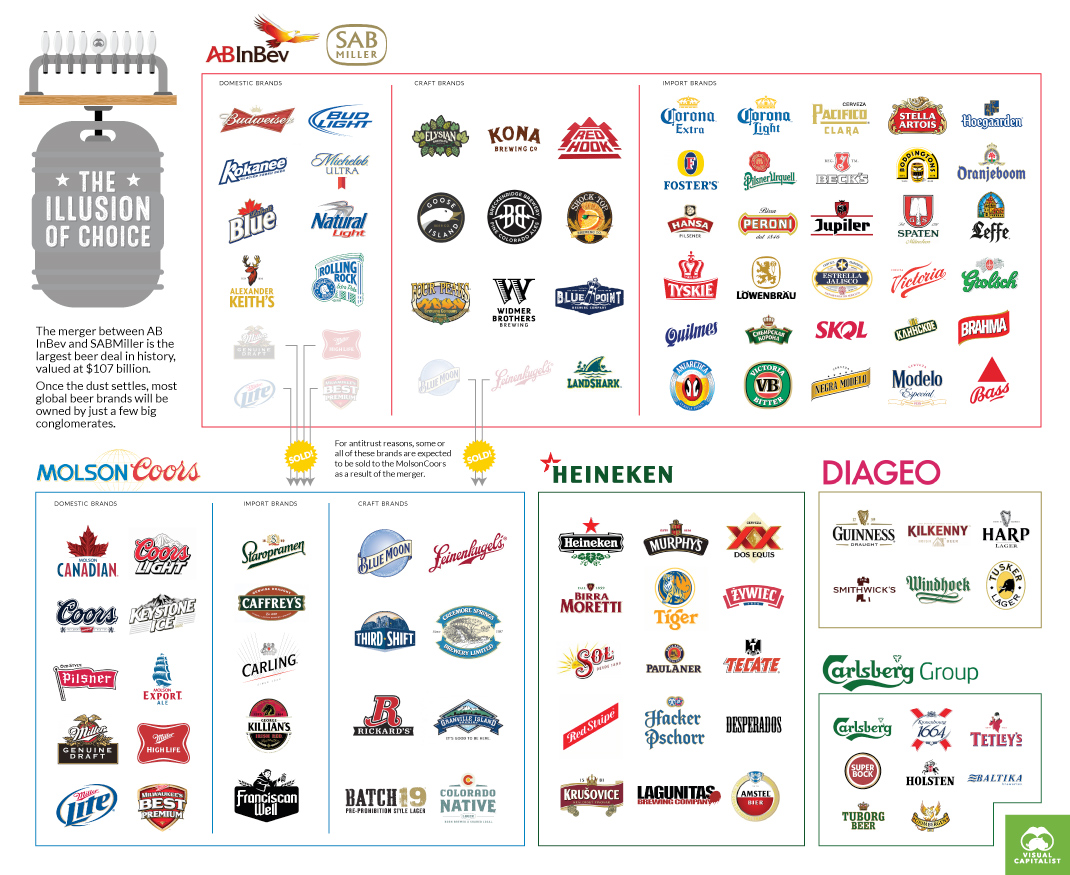
These 5 Giant Companies Control the World's Beer infographic created by Visual Capitalist illustrates the "illusion of choice" idea. Even if a bar has 50 beers on tap, those beers and their breweries are owned by another bigger company, and there are only 5 of them! 

The next time you hit your local pub, the odds are that the pint of beer you order will come from one of five global beer conglomerates.

Together, they own hundreds of the best-known domestic, import, and craft beer brands all over the world, in pretty much any country you can name. Whether you are seeking a smooth pilsner, a creamy stout, or an old-fashioned ale to whet your whistle, this multi-national beer oligopoly has got you covered.

THE BIG FIVE

Until recently, there were actually six big conglomerates: AB InBev, SAB Miller, MolsonCoors, Heineken, Diageo, and Carlsberg. 

However, in mere weeks that will no longer be true. The world’s two largest beer companies – AB InBev and SAB Miller – are merging into one massive megabrewer. The deal, which is worth a hefty $107 billion, is expected to close by October 2016.

When it is all said and done, the merged company will have a brand portfolio that will be the envy of the industry: Budweiser, Corona, Stella Artois, Hoegaarden, Pilsner Urquell, Foster’s, Shock Top, Elysian, and Beck’s are just some of the flagship brands involved. 

That will be after likely divesting several key brands such as Blue Moon and the entire Miller line of beers to appease antitrust regulators.

THE ILLUSION OF CHOICE

As we said previously when we posted the infographic showing the illusion of choice in consumer brands, we believe it is important for you to be aware of who is supplying the different brands and goods served at your dinner table.

Each dollar you spend is a vote – make sure it goes to a product and company that you believe in.

This type of design is commonly called a "Landscape", in this case it's the Landscape of Beer Companies. They are good for showing groupings of companies, products or brands, but I'm generally not a fan because they can become too complex. This one does a good job keeping the content simple and delivering a clear message that readers can easily understand.

Found on Dailyinfographic.com.

Monday
Nov062017

How Brands Are Using Instagram Stories

How Brands Are Using Instagram Stories infographic

Klear analyzed 149 brands in 8 different industries to see How Brands Are Using Instagram Stories to drive sales.

Just last year, brands faced a big issue on Instagram: sharing external links with followers. Can you recall posting about a new blog post on your account and having to direct followers to your bio to click the link? No one cared to take the time to go to your account and check out the content. This wasn’t a convincing nor effective method and the low rate of user responsiveness made this a big loss of interest for marketers.

Although just a few months after the birth of Instagram Stories, came their golden solution to every marketers’ problem.

Instagram introduced a “swipe up” feature, allowing brands to link a URL to their story, creating a “see more” option below the post. Then if users wished to see further content, it was only a swipe away, thus creating greater user compliance. The linking component is only available for verified accounts. For the marketers who can use it, it’s a dream.

We were already aware of the popularity surrounding Instagram Stories, but we wanted to see how brands are utilizing this newer feature. We decided to follow 149 top brands in 8 industries – including Amazon, Adidas, JetBlue, and Coca-Cola – to see what do they share on their stories and where they guide their followers to.

Read more at Klear.com

I like the data, and the clear sequence of sections. The thin doughnut chart is really hard to read and connect the colors to the legend. The stacked bar chart at the end is very busy and hard to read as well.

Found on Marketingprofs.com

Tuesday
Jul282015

Largest Company by Revenue in Each State 2015

Largest Company by Revenue in Each State 2015 map

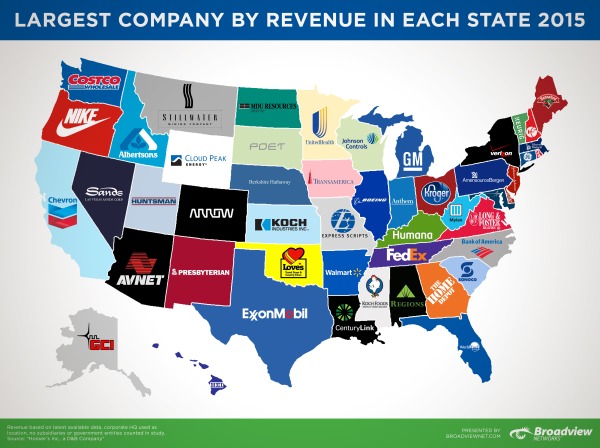
The Largest Company by Revenue in Each State 2015 map was created by Broadview Networks by using Hoover’s, a D&B Company's data. Even though there might be "bigger" companies in each state than the ones represented, the map is specifically looking at the greatest amount of revenue from the 2015 financial year.

You may have seen the Largest Companies by Revenue map we put together in June of last year, well we’re back with an updated version using Hoover’s 2015 data.  Last year’s map created so much buzz and insightful conversation that we deemed it essential to find out how it’s changed over the past year.  Using Hoover’s, a D&B Company, we searched through each state’s list of companies to find which had the largest revenue in the last fiscal year.  It was interesting to see how each company’s revenues have changed over the year (for better or worse) and to see if a new largest company had emerged.

At first glance, you may ask, “Where are Apple and Microsoft?”  Yes, these are huge companies but this map is specifically looking at total revenue from the last fiscal year.  If we look at California with Apple vs. Chevron, there is a large discrepancy between market value and total revenues.  Apple’s market value as of March 31, 2015 was $724 billion while Chevron’s was only (and we use “only” lightly) $197 billion.  In terms of revenue, Chevron comes out on top with $203 billion in the last fiscal year while Apple had revenues of $182 billion.

Please note: We used Hoover’s company database as our source, not the most recent Fortune 500 list.  Location and state are based on the corporate headquarters of that company, no branches or foreign offices.  Lastly, we decided not to include any subsidiaries or government entities for the sake of staying consistent.

I liked how they didn't manipulate the US map. Manipulation would have taken the focus away from the company's logos. If you click on the infographic, the original allows you to zoom in close enough to comfortably see small states, like CVS is Rhode Island's largest company of 2015. This infographic could of easily been overworked but instead they kept it simple.

The company post inspired a lot of discussion about the data, and I think that was part of the purpose behind the design. Is this the best data to show? Where are some of the more recognizable companies? There's even at least one error in the map.

Found on Broadview Networks VoIP Blog

Thursday
Jan292015

The Salesforce Economy

The Salesforce Economy infographic

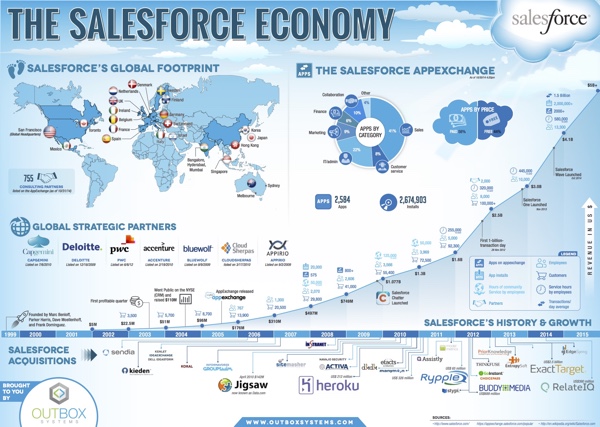
The Salesforce Economy infographic created by Outbox Systems is an overview of where the company is today and a little history on how it came to be.

Salesforce is a global powerhouse.  This infographic displays the Salesforce economy, including the company’s growth, global reach, timeline and more.

This design is a great visual summary of the corporate history of Salesforce. Revenue growth, global presence, acquisitions, strategic partners and an overview of apps. EDIT: You can download the high-resolution PDF version on their landing page.

The overall design is pushing the Fair Use of the Salesforce trademark pretty far. One of the trademark infringement tests is the “possibility for confusion”, and I wouldn’t be surprised if some readers walk away thinking this is an official infographic put out by Salesforce instead of Outbox.

Thanks to Darren for sending in the link!

Wednesday
Dec032014

40 Brand Logos with Hidden Messages

40 Brand Logos with Hidden Messages infographic

Some of the best known logos hide the best kept secrets. 40 Brand Logos with Hidden Messages infographic designed by Oomph! reveals some of those secrets. How many did you already know?

You probably already know the story behind the famous FedEx logo and its clever use of negative space. (If you don’t, read this.) But of course, it’s hardly the only logo with a “hidden message.”

British plastic card maker Oomph has collected 40 such logos—check them out below. Amazon, Unilever and the Tour de France are particularly cool. How many of these sneaky messages would you have spotted without the help?

You can’t cover this topic without the visuals, and that’s why this infographic is so effective. It shows you the logos with clear explanations of the stories behind them.

The footer should include the uRL to the infographic landing page, so readers can find the original, full-size version when they find this design on other sites across the Internet.

Found on: http://www.adweek.com and http://www.thedrum.com

Tuesday
Apr162013

The Anatomy of the Social Media Command Center

The Anatomy of the Social Media Command Center infographic

Beingyourbrand.com has created The Anatomy of the Social Media Command Center so that you can learn more about a few of their favorite social media command centers, and how to construct your own.

In the recent months, many major brands have developed what they are calling “Social Media Command Centers.” These centers are state-of-the-art listening hubs that allow brands to monitor their presence on major social platforms and be ultra-responsive to conversations happening about their company. However, with all their glamor, are these command centers really capable of delivering results, or are they just for show?

The following infographic, looks at three of the most noteworthy examples of social media command centers:

  • The University of Oregon’s Quakecave in Autzen stadium
  • Gatorade’s Mission Control at their Chicago headquarters, featuring custom visualization from STRUCKUndercurrent, and Radian6
  • The American Red Cross Command Center powered by Dell

More of a visual explanation, the design does share some common points of data like number of employees and a relative scale of the amount of data being collected.  It’s a good design that clearly explains this new marketing function to readers.

The URL link to the infographic landing page on the should have been included in the footer to help readers find the original full-size version when the infographic is shared on other sites (like this one).  Especially a good idea since this was posted on their blog, and will get buried in the archive over time.

Thanks to Matt for sending in the link!

Wednesday
Jun132012

The Value of Retail-Integrated eCommerce

The Value of Retail-Integrated eCommerce

What can Retail-Integrated eCommerce do for your brand? is a new infographic based on a research study from Shopatron.  

Retail-integrated eCommerce is a business model that allows branded manufacturers to sell directly to consumers and pass those orders to their retailers for delivery to the customer. According to March 2012 surveys answered by over 200 branded manufacturers and 1,300 retailers, retail-integrated eCommerce benefits branded manufacturers in the following ways.

This is obviously a design for a niche audience, but I can tell you from past experience that Branded eCommerce is a HUGE challenge.  A company makes products for the end user; however, their immediate customers are usually retail stores.  As soon as a product company starts trying to sell their products on their own website (cutting out the retail store), they suddenly become a competitor to all of the existing retail store customers.  The idea of Retail-Integrated eCommerce is a potential solution.

The statistics at the bottom of the infographic that explain this challenge (not visualized) are so important, I think they should have been visualized and highlighted at the top of the design.  This is the background information that makes the rest of the infographic relevant.

In 2012, 70% of retailers said they would reduce buying from brands that sell online directly to consumers, with 9% saying they would cease buying from that brand altogether.

This is a good design that doesn’t try to throw too much information at the reader.  Most of the important data points are clearly visualized with short descriptions.  The orange color scheme clearly identify the design with the Shopatron brand.

You can also download the PDF version here.

Monday
Apr302012

Just How BIG Is Apple?

Watch out New York! There’s a new Big Apple in town! The Just How BIG Is Apple? infographic from bestcomputersciencedegrees.com illustrates how important Apple really is to us.  Pardon me while I check a text on my iphone and post this with my Mac…

It is the first company to successfully pivot from computer maker to device maker. And its devices are now ubiquitous, its annual new product releases are among the most anticipated in the world and it recently announced it would begin issuing a dividend to its stock owners expected to generate $10 billion in the first year alone. There is also speculation that Apple will enter into the payments market in the near future (allowing its handheld products to serve in the same fashion as a credit card). This alone would turn them into a trillion dollar company.

Love this clean, easy-to-read design.  I understand the sized red bars surrounding the world map, but the GDP values are so close to each other that this visualization makes it very hard to compare between countries.  A rose diagram behind the world map might have worked much better.

I love the use of the company logos to make the bar chart more visual.  The work “billion” could have been removed from each of the values, and made into the chart scale.  There’s one bar between Google and P&G that is missing it’s company logo.  The bar chart makes this very easy for the reader to compare values between the companies, and it should identify the date these market capitalizations were gathered since these values change every day.  It also needs a copyright statement, and the URL of the origianl infographic post so readers can get back to the original high-resolution infographic. 

Found on Infographic Journal