About
Randy Krum
President of InfoNewt.
Data Visualization and Infographic Design

Infographic Design

Infographics Design | Presentations
Consulting | Data Visualizations

DFW DataViz Meetup

Join the DFW Data Visualization and Infographics Meetup Group if you're in the Dallas/Fort Worth area!

Search the Cool Infographics site

Custom Search

Subscriptions:


Feedburner

The Cool Infographics® Gallery:

How to add the
Cool Infographics button to your:

Cool Infographics iOS icon

- iPhone
- iPad
- iPod Touch


Read on Flipboard for iPad and iPhone

Featured in the Tech & Science category

Flipboard icon

Twitter Feed
From the Bookstore

Caffeine Poster

The Caffeine Poster infographic

Entries in companies (42)

Thursday
Sep292016

Visualizing the Fortune 500

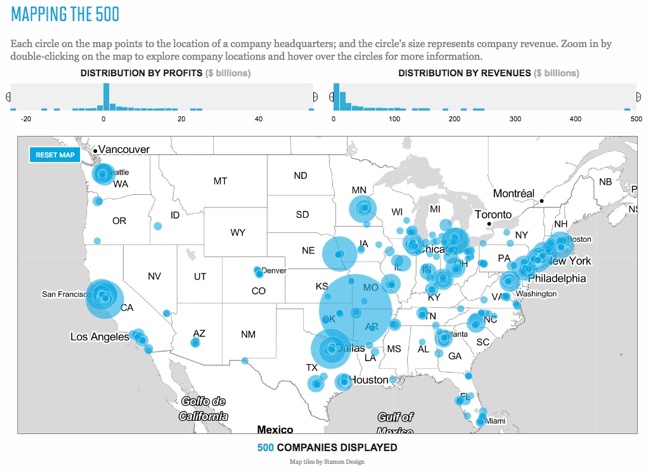
Visualizing the Fortune 500 interactive data visualization

Visualizing the Fortune 500 is an experiment by the team at Fortune magazine. This is an interactive data visualization site that shows the location of each company's headquarters and the size of the circle represents the company's annual revenue.

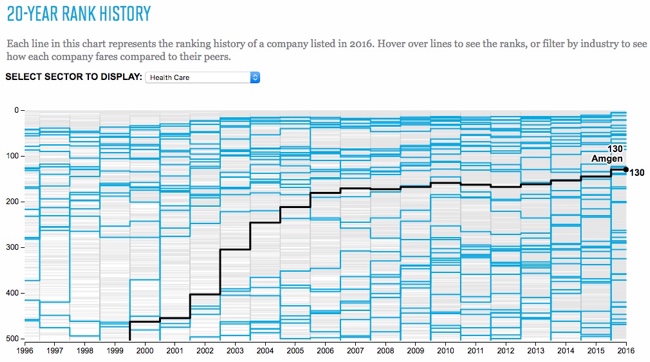
People visit and revisit the Fortune 500 for lots of reasons, chief among them: job prospects, sales leads, corporate research and investor information. And bragging rights, of course. Below are two visualizations that allow you to explore the Fortune 500. On the map you'll find every one of the U.S. headquarters from the 2016 list, on the line chart below it, you'll see how each of the companies on the 2016 list has moved through the ranks for the past 20 years.

They also show an interactive visualization of how the companies have moved through the ranks over the last 20 year history of the Fortune 500.

Designed by Nicolas Rapp, using map tiles from Stamen Design.

Friday
May272016

The Infographic Resume by Hannah Morgan: Interview & Giveaway

The Infographic Resume is a fabulous book by Hannah Morgan from Career Sherpa! I have a chapter dedicated to infographic resumes in my book, Cool Infographics, but this is the only entire book I've seen dedicated to infographic resumes anywhere. Find more on Hannah's book page.

This month I am giving away one signed copy of The Infographic Resume! Register on the Giveaways Page by June 30th to be entered.

Infographic resumes are in, and they’re not just for designers. Free online tools are popping up every day to help anyone create a dynamic, visual resume—adding panache without sacrificing substance for style.

The Infographic Resume provides essential tips and ideas for how to create visual resumes and portfolios that will make you stand out from the crowd. Richly illustrated in full color and including lots of inspiring examples, the book will teach you how to:

  • Create a powerful digital presence and develop the right digital content for your goals
  • Build your self-brand and manage your online reputation
  • Showcase your best work online
  • Grab a hiring manager’s attention in seconds

Packed with dynamic infographics, visual resumes, and other creative digital portfolios, The Infographic Resume reveals the most effective tools, eye-catching strategies, and best practices to position yourself for any job in any kind of business.

Everyone should follow Hannah Morgan on Twitter (@careersherpa)! She shares her wisdom and insights on resumes, hiring and career issues openly. You can download her Infographic Resume Cheat Sheet, and she maintains a Pinterest Board gallery of Infographic and Visual Resumes.


Hannah answered a handful of questions about The Infographic Resume:

How would you define an infographic resume?

Hannah: An infographic resume converts your work experience into visual pieces such as charts and graphs. Instead of finding the right words to write about your skills and achievements, you can present the most important parts of your experience visually. While this may sound difficult for some people, especially those without design skills, it can actually be liberating. As the saying goes, a picture is worth a thousand words.

Chapter 1 was great! Could you summarize your chapter on How We Got Where We Are Today?

Hannah: You may have noticed infographics and other visual elements appearing more often in newspapers, marketing materials and social media than in the past. We are inundated with information and rely on our smart phones for on-the-go access. Reading large blocks of text takes time and it is even more difficult to read on a mobile device. Studies indicate that the brain processes pictures faster than words. Other studies say pictures increase comprehension, increase the time people spend on a website, and increase sharing of updates on social media. Job seekers can leverage these trends to their advantage. Savvy job seekers know today’s job market is highly competitive. To make matters worse, almost every company has an Applicant Tracking System (ATS) which typically weeds out candidates and results in the dreaded “black hole” of no response. Technology has enabled job seekers to break out of the standard “apply online and wait” mold. By applying out-of-the-box marketing strategies such as social media campaigns, personal websites and infographic resumes, job seekers can do more to stand out and garner the attention they crave (and deserve). 

How would you describe the current state of the market for infographic resumes?

Hannah: Infographic resumes deviate from the expected and that is the very reason to use one. Most job seekers will not use one either because they don’t know about them, don’t know how to create on or think it would be risky to try and use one. In my opinion, the rewards outweigh the risk. Go ahead, use an infographic resume.

What are some of the more unexpected jobs or careers that you have seen candidates use an infographic resume?

Hannah: The early adopters of infographic resumes were people who had graphic design skills. But infographic resumes are being created by technical writers, sales representatives, information technology specialists and many other types of occupations. Infographic resumes demonstrate creativity and innovative thinking which are qualities valued in marketing departments, information technology, and start-up organizations, just to name a few. Consider the culture of the organization and the requirements of the role to help determine if an infographic resume might be successful opening doors.

Are there any risks associated with infographic resumes?

Hannah: There are some things you should know before you use an infographic resume. First, and foremost, do not use infographic resumes when submitting through applicant tracking systems! The technology used in ATSs cannot read visual content. You should also take into consideration who you are sending your infographic resume to. Typically, people in human resource and recruiting roles expect to see the traditional, conservative text resume. These roles often have to review hundreds, if not thousands, of resumes and do not have time to search your infographic for skills and work history. A better strategy is to send your infographic resume to the actual hiring manager or to a contact you have made inside the organization. Infographic resumes also make a great addition to your LinkedIn profile as embedded media in the summary section. If you have a personal website or online portfolio, an infographic resume works well there too. If you are proactively networking with people in your field of interest, bring your infographic resume to the meeting and share it to guide the conversation. And why not bring an infographic resume to an interview to impress the interviewers?

What types of reactions to infographic resumes are you hearing from hiring managers and recruiters?

Hannah:  About a year ago, I polled the recruiters, human resource professionals and career coaches in my network to get their feedback on infographic resumes and the overwhelming response was positive. In fact, 68 percent said they would look at an infographic resume, 32 percent said it would depend and no one said that they wouldn’t look at one. Here are some of the comments I received: 

“I would welcome a fresh, newer idea, which this is, as opposed to the same old resume.” -Hiring Manager

“Shows some creativity.”  -Other

“Yes! I would be thrilled with the creativity, and it would definitely be a resume that would stand out from the pack.” – Hiring Manager

“Yes, because normal resumes are boring.” -Other

Do you have your own infographic resume that I could share?

Hannah: Since I don’t have design skills, I rely on tools that convert my LinkedIn profile into an infographic resume, like this one created using vizualize.me. There are so many tools available to help create infographics so even people without design skills or familiarity with design software can dabble in infographics. I’ve written about four of those tools here: http://careersherpa.net/4-templates-for-infographic-resumes/


Hannah's Bio:

Hannah Morgan is the Founder, CareerSherpa.net and a Job Search Strategist. She is a speaker and author on  job search and social media strategies. She delivers fresh advice and serves as a guide to the treacherous terrain of today’s workplace landscape. Hannah’s experience in Human Resources, Outplacement Services, Workforce Development and Career Services equip her with a 360 degree perspective on job search topics. Recognized by media and career professionals, Hannah is an advocate who encourages job seekers to take control of their job search. Hannah is frequently quoted in local and national publications and she writes a weekly column for U.S. News & World Report.

Hannah is the author of “The Infographic Resume” (McGraw Hill Education, 2014) and co-author of “Social Networking for Business Success” (Learning Express, 2013). You can learn more about Hannah on CareerSherpa.net and by following her on Twitter at @careersherpa.

Wednesday
Dec022015

10 Things You Need to Know About Logo Design

10 Things You Need to Know About Logo Design infographic

Logos are more than just a stamp on a page, they embody the whole meaning behind your product. The 10 Things You Need to Know About Logo Design infographic from Blue Soda Promo wants to make sure that you make the best decision when choosing your design.

“People are more likely to remember the company logo, an illustration representing the company, than the actual name of the company. When it comes to purchase decisions, consumers are more likely to buy products from familiar companies. When buyers are in a store looking at products on the shelf, they are more likely to choose the products from companies they recognize, and logos are more likely to be remembered. Companies know this, and are very careful to design their product packaging to clearly show the company or brand logo.”

*Excerpt From: Randy Krum. “Cool Infographics.” - bit.ly/CoolInfoBook

There is a nice comical feeling to the infographic that is consistent throughout. It is good to keep consistency when designing all parts of an infographic.

Nike’s swoosh, McDonalds’s golden’s arches, and Apple’s bitten fruit all have one thing in common…

Well, that’s not exactly true as you’ll find out later in this post.

However! What they do share is the overarching success their logos have had on the world. People no longer need to be told what their logos represent. When their logos are stamped on something they have certain consumer expectations attached to it. Their logos became their own company’s spokespeople, while their products continue to prove their worth.

Examples are key for this kind of topic. People will understand the importance of the points better when the examples are clear and easy to recognize. It also helps reinforce the idea that a logo embodies the personality of the company. When the author changes one of the logos we are familiar with, it just doesn't feel right!

Thanks to Matt for sending in the link!

Monday
Nov022015

The Increasingly Crowded Unicorn Club

The Increasingly Crowded Unicorn Club infographic

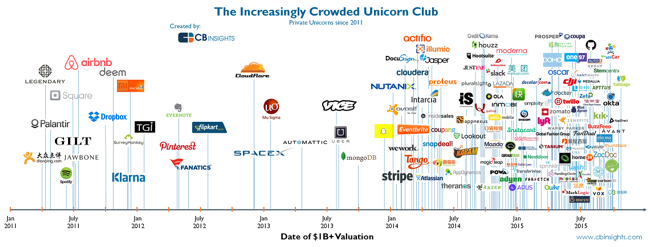
The Increasingly Crowded Unicorn Club is visualized by CB Insights in this chart showing the dates when these 141 companies became unicorns by reaching the $1 Billion valuation mark.

We looked at all still-private unicorns since 2011 and charted them based on when they first joined the unicorn club. While initially the chart shows unicorns being created at a relatively calm pace, the rhythm accelerates noticeably in late 2013 (right around the time Aileen Lee wrote her famous post coining the term unicorn in November 2013). Since then, there has been an explosion in unicorn creation, with over 60 new unicorns in 2015 alone.

The heights of the lines have no meaning, they are just connectors to the company logos.

This is a really good visualization that tells one story really well without crowding it with a bunch of extra information about the companies. Knowing that the image will most often be shared as a stand-alone piece, it would have been teer for them to include the URL back to the original infographic and a copyright statement in the infographic JPG image file itself.


Tuesday
Aug182015

The State of the Social Marketing Team

The State of the Social Marketing Team infographic

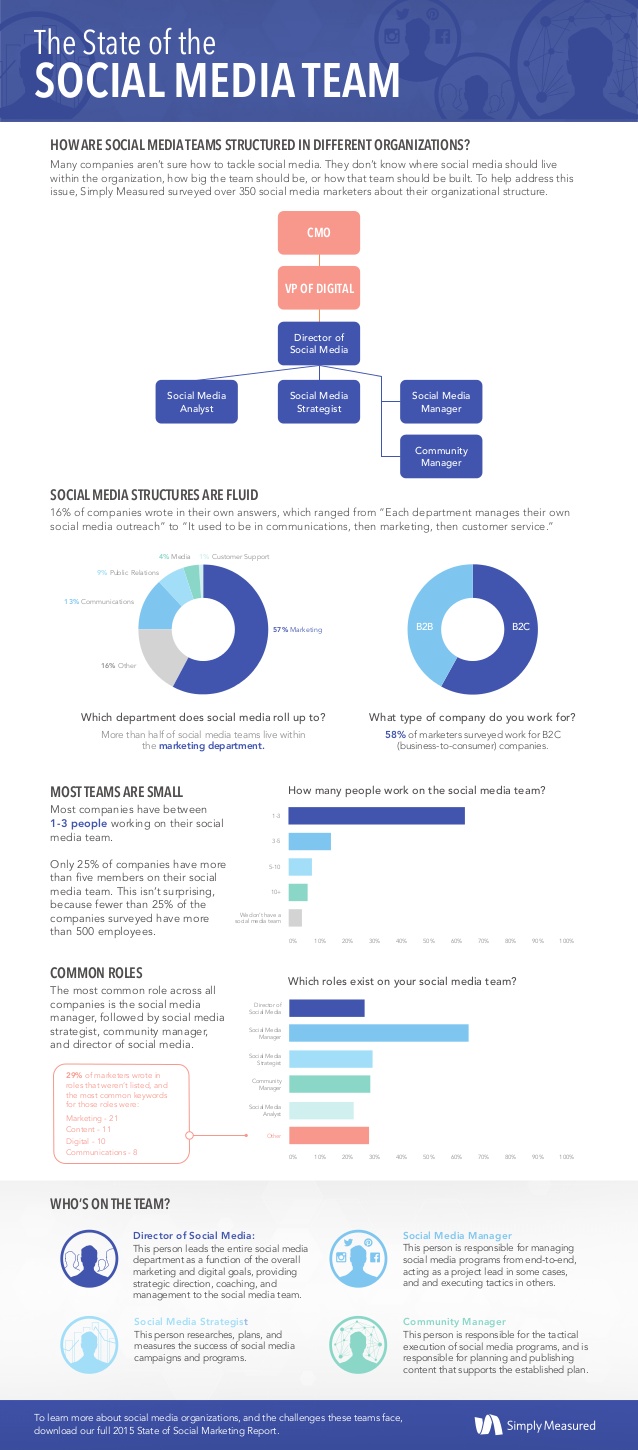
The State of the Social Marketing Team is an infographic from a survey that SimplyMeasured put together and shared in the full 2015 State of Social Marketing report. This is the right way to use an infographic as the visual summary of deeper content hidden behind a registration wall.

Many companies are still trying to figure out how to tackle social media. They’re constantly asking themselves questions like, “Where should social media live in our organization?,” “How big should my team be?,” or “How should our social media team be built?”

To help address this common issue, we surveyed over 350 social media marketers about their team structures and compiled our findings into this infographic! More information from the survey (as well as a separate look at the pain points these marketers face), download a complimentary copy of our 2015 State of Social Marketing Report.

This is a really good infographic. Packed with good information and keeps the design simple and to the point. My only issue with the design is that some of the text is small and in light colors that are hard to read against the white background.

I noticed that SimplyMeasured posted the original infographic on SlideShare and then posted it in their blog by using the SlideShare infographic wrapper for sharing. SlideShare introduced the Infographics Player in 2013, but I haven't seen many people using it. The potential advantage is that most of the view metrics from mutliple sites are combined together in SlideShare. The potential disadvantge is that people go to SlideShare to view your infographic and never make it to your website. 

Found on MarketingProfs

Tuesday
Jul282015

Largest Company by Revenue in Each State 2015

Largest Company by Revenue in Each State 2015 map

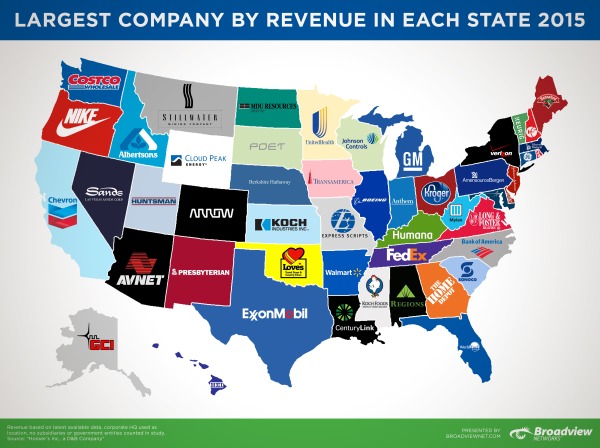
The Largest Company by Revenue in Each State 2015 map was created by Broadview Networks by using Hoover’s, a D&B Company's data. Even though there might be "bigger" companies in each state than the ones represented, the map is specifically looking at the greatest amount of revenue from the 2015 financial year.

You may have seen the Largest Companies by Revenue map we put together in June of last year, well we’re back with an updated version using Hoover’s 2015 data.  Last year’s map created so much buzz and insightful conversation that we deemed it essential to find out how it’s changed over the past year.  Using Hoover’s, a D&B Company, we searched through each state’s list of companies to find which had the largest revenue in the last fiscal year.  It was interesting to see how each company’s revenues have changed over the year (for better or worse) and to see if a new largest company had emerged.

At first glance, you may ask, “Where are Apple and Microsoft?”  Yes, these are huge companies but this map is specifically looking at total revenue from the last fiscal year.  If we look at California with Apple vs. Chevron, there is a large discrepancy between market value and total revenues.  Apple’s market value as of March 31, 2015 was $724 billion while Chevron’s was only (and we use “only” lightly) $197 billion.  In terms of revenue, Chevron comes out on top with $203 billion in the last fiscal year while Apple had revenues of $182 billion.

Please note: We used Hoover’s company database as our source, not the most recent Fortune 500 list.  Location and state are based on the corporate headquarters of that company, no branches or foreign offices.  Lastly, we decided not to include any subsidiaries or government entities for the sake of staying consistent.

I liked how they didn't manipulate the US map. Manipulation would have taken the focus away from the company's logos. If you click on the infographic, the original allows you to zoom in close enough to comfortably see small states, like CVS is Rhode Island's largest company of 2015. This infographic could of easily been overworked but instead they kept it simple.

The company post inspired a lot of discussion about the data, and I think that was part of the purpose behind the design. Is this the best data to show? Where are some of the more recognizable companies? There's even at least one error in the map.

Found on Broadview Networks VoIP Blog

Friday
Feb272015

Overtime Pay Laws

Call Center Employee Overtime Pay Laws infographic

The Call Center Employee Overtime Pay Laws infographic from overtimepaylaws.org is in informative design can help both employees and employers understand the rules when it comes to paying overtime.

Call centers employ thousands of workers throughout the United States. Many call center employees are required to perform tasks before a shift and after a shift that are not considered “on the clock” by their employer, such as booting up a computer or loading dialing software. This additional time spent on these tasks can give rise to an overtime pay lawsuit brought under the Fair Labor Standards Act. Our Call Center Overtime Pay Infographic Explains the important issues in these cases.

This design follows a simple story format with only a few steps:

  1. What’s the Problem?
  2. What’s the Impact?
  3. What can the Reader do?

 I love that this design simplifies the information, and doesn’t try to include too much detail.

Wednesday
Feb252015

Five Innovative Ways Companies Are Using Infographics to Share Data

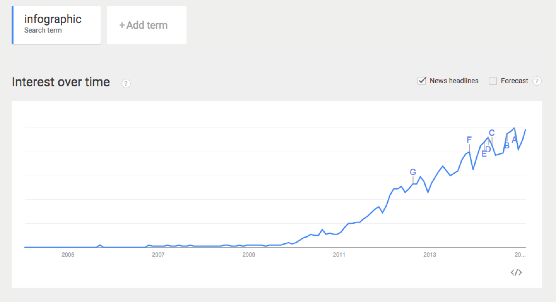
The popularity of turning data into visuals has skyrocketed in recent years. Especially the keyword “infographic,” as evidenced through Google Trends. This has sent capable marketers scrambling for a competent team of: designers, copywriters, and producers to create new and exciting content. While charts and graphs are nothing new, the way they are displayed visually (and the stories they can tell), is expanding into uncharted waters.

via: Google Trends - “Infographic”

Infographics and data visualizations were once the playthings of academics. Beautiful displays of information were created and tucked away in their ivory towers of academia. Those days are now long over, and the power of data combined with visual information has been passed on to the masses.

For a while, it seemed nearly everyone under the sun was creating infographics. This resulted in an over-saturation of infographics online, with marketers cranking them out as fast as possible. Complete with often poor designs, and misleading data.

While this over-saturation did hurt the online marketing reputation of infographics slightly, their growth in online popularity did not. This online exposure and awareness of infographics has driven a significant increase in the use of infographics inside companies as well.

To help clear the air, check out these six examples below for how companies are coming up with innovative ways to use infographics.  


1. Hotels.com: PR Infographics

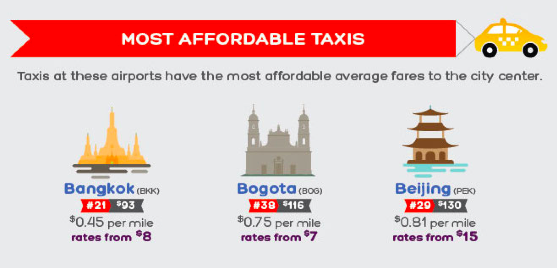
Traveling and flying to new cities can be equal parts exciting and terrifying. This infographic from Hotels.com, provides travelers with valuable insights they should know before arriving in major cities around the world. This infographic is great because it gives their customers valuable information (and saves a bit of decision-making time) to make their transition from the sky to the city that much smoother.

Another great thing about these infographics is that they are specifically targeting the press with their proprietary internal data. This builds their credibility by sharing their expertise and valuable insight into the hotel industry. They’re not just telling the press, they’re showing them the data visually as well.


2. Wine Folly: Food and Wine Pairing

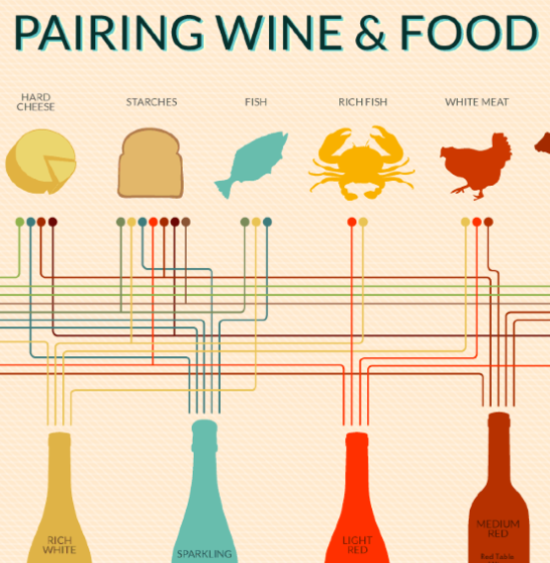
This infographic from Wine Folly looks at all the different taste profiles, such as sweet and sour, to create the perfect food and wine pairings. The great thing about this infographic is its online life span - which can easily last for many years. Twenty years from now, the information will still be the same, and the design will still be relevant to readers.

Online lifespan can make a huge difference to the ongoing SEO value of any infographic, and should be an integral part of the topic selection process.


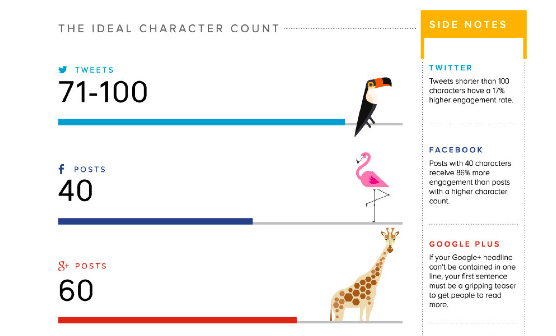
3. SumAll: The Internet is a Zoo - The Ideal Length of Everything Online

This infographic from SumAll looks at something we all struggle with: our attention spans. How many characters long should a Facebook post be? What is the ideal subject line length? How many words should a blog post be so that it actually gets read? All the answers to your burning questions are here in one place. 

What makes this graphic so good is that these observations apply to all social media audiences, no matter what industry they come from. It’s a valuable topic for marketers in any industry.


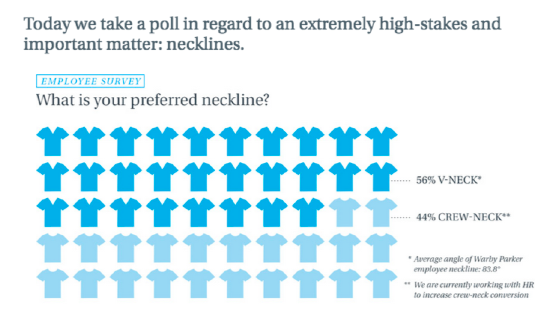
4. Warby Parker Annual Report

The annual report is getting a strong makeover thanks to innovative companies like Warby Parker. The annual report used to be a non-event. Everyone made an annual report, and they all basically looked and felt the same; i.e. lots of words, mixed in with some charts and graphs. Warby Parker really hit the mark with their 2013 Annual Report

In an article on Business Insider, they explain how Warby Parker’s previous two annual reports fit into it’s quirky brand, but the 2013 annual report is it’s most ambitious. It may seem like it has plenty of meaningless information, but it’s a smart business move. Because amidst all of the meaningless information, you begin to realize that it’s not actually an annual report at all, but a giant advertisement intended to become viral. This resulted in some of their biggest sales days.

Seeing as how every business loves talking about itself on social media, it’s surprising it has taken this long for the annual report to become relevant again.


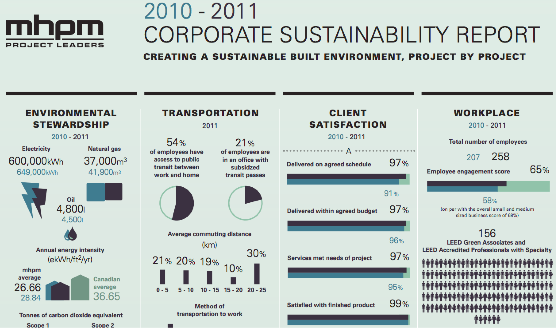
5. MHPM Corporate Sustainability Report

This infographic from MHPM examines the creation of a sustainably built environment, project by project. More and more, sustainability matters to clients, employees and the communities they all live and work in. With the right practices in place, a sustainable building is worth more (and costs less to operate) than traditional buildings, helping to make them an attractive choice versus competitors.

This new application of infographics lets MHPH tell their own story in a visually appealing way. By providing the numbers behind their commitment to keeping their projects green, MHPM has not only helped prove their own claim that Sustainability is Free™, but they also share how they can help their customers.

As we have seen over recent years, infographics have continued to grow in popularity. Giving rise to a new Internet, continually heading in the direction of displaying more advanced, and beautiful ways to visualize information. What are some other creative uses of infographics you have seen lately?

Wednesday
Dec032014

40 Brand Logos with Hidden Messages

40 Brand Logos with Hidden Messages infographic

Some of the best known logos hide the best kept secrets. 40 Brand Logos with Hidden Messages infographic designed by Oomph! reveals some of those secrets. How many did you already know?

You probably already know the story behind the famous FedEx logo and its clever use of negative space. (If you don’t, read this.) But of course, it’s hardly the only logo with a “hidden message.”

British plastic card maker Oomph has collected 40 such logos—check them out below. Amazon, Unilever and the Tour de France are particularly cool. How many of these sneaky messages would you have spotted without the help?

You can’t cover this topic without the visuals, and that’s why this infographic is so effective. It shows you the logos with clear explanations of the stories behind them.

The footer should include the uRL to the infographic landing page, so readers can find the original, full-size version when they find this design on other sites across the Internet.

Found on: http://www.adweek.com and http://www.thedrum.com

Friday
Apr112014

Color, Value, and Evolution of Logos

Color, Value, and Evolution of Logos infographic

Logos are very important to a business. A good logo can sell itself, especially if the colors match the product correctly. Color, Value, and Evolution of Logos infographic found on Finances Online.

Do you know how colors influence your buying decisions? Why the charging bulls in the Red Bull logo are red? Or why McDonald’s double arches are yellow? It’s because the emotional power of logos is closely tied to specific colors.

It turns out, our emotions are results of the precise science of effective logo design. In fact, psychologists proved that famous logos are so wired into our brains, that at the age of 2 kids can already link a product with its logo in 67% of cases. You can find even more interesting facts about logos in our latest 

The meaning behind logo colors is always a popular infographic topic, and you can see some prior posts here.  This design goes a bit further by also looking at brand values, the cost to design some of the more famous logos and how some logos have evolved over the years. 

Some portions of the design are too visually busy, and hard for the reader to follow.  Too many different fonts makes the information hard to read, and too much text detracts from the appeal of the visuals.  However, showing the actual logo images is key to sharing this information, and they do a good job of including relevant examples.

I really like that they added a few “Tweetable Facts and Figures” on the landing page below the infographic to help encourage readers to share the infographic.  They even have convenient “Tweet This” links that will fill in the Twitter post with the text for the user. 

Thanks to Alex for sending in the link!