About
Randy Krum
President of InfoNewt.
Data Visualization and Infographic Design

Infographic Design

Infographics Design | Presentations
Consulting | Data Visualizations

DFW DataViz Meetup

Join the DFW Data Visualization and Infographics Meetup Group if you're in the Dallas/Fort Worth area!

Search the Cool Infographics site

Custom Search

Subscriptions:


Feedburner

The Cool Infographics® Gallery:

How to add the
Cool Infographics button to your:

Cool Infographics iOS icon

- iPhone
- iPad
- iPod Touch


Read on Flipboard for iPad and iPhone

Featured in the Tech & Science category

Flipboard icon

Twitter Feed
From the Bookstore

Caffeine Poster

The Caffeine Poster infographic

Entries in companies (42)

Wednesday
Apr022014

The Enterprise Mobility Ecosystem Map

The Enterprise Mobility Ecosystem Map infographic

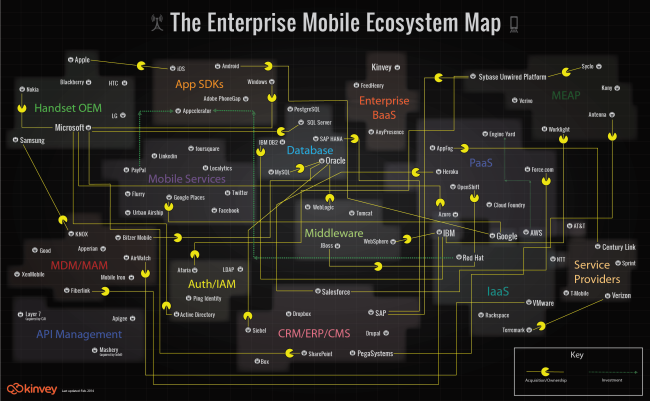
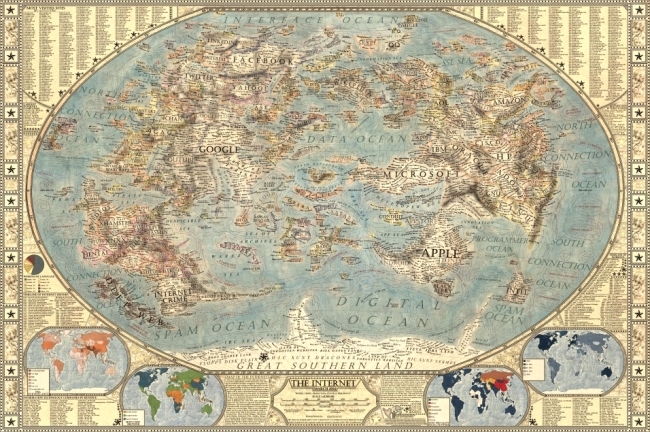
The Enterprise Mobility Ecosystem Map published by Kinvey attempts to make sense of the ownership and acquisitions rapidly taking place within the mobile backend providers.  Platforms for authorization, payments, location services and software development kits (SDKs).

Enterprise mobility is a classic IT disruptor. It’s the kind of disruptor that companies like IBM, Oracle and VMware, SAP, Salesforce, etc. were built on. It may look like a peripheral part of IT infrastructure now, but since mobile will be the primary access point to apps and data for many enterprises, many — if not most — new apps are going to be “mobile first.” Thus, the entire IT infrastructure is going to have to become very mobile friendly, very quickly, or else risk becoming a legacy platform.

As a consequence, major IT vendors are partnering with or acquiring companies throughout the mobile stack. Market consolidation and investments have taken place in MDM, API Management, cloud and handset markets. To visualize this activity, we’ve produced the Enterprise Mobile Ecosystem map below.

A network map visualization like this can help companies figure out where their business plays, and how other company acquisitions around them may impact their business.  I like that the design is purely informational, and doesn’t add a lot of extra data or information to the design.  The message is all about the connections, and doesn’t include things like the size of the companies or the value of the acquisitions.  This keeps the infographic focused on telling one story really well.

I would recommend using the company logos in the subway map style design to make it faster and easier for the audience to recognize the companies involved.  It’s much harder for the readers to read all of the company names in text to find the companies they recognize.

The Pac-man icons are a nice touch to indicate the direction of ownership or acquisition.

Monday
Mar312014

Map of the Internet 2.0 Poster

Map of the Internet 2.0 Poster

Designer Martin Vargic has released an updated version of his Map of the Internet 2.0 that creates what looks like a vintage-style map.  However, this version plots out the major websites and technology companies, with related sites grouped together on the same continent.  The sizes of the websites on the map are scaled relative to their number of visitors, so bigger sites show as bigger geographic regions.

Second version of our flagship project, the Map of the Internet.

This conceptual work of cartography treats major internet sites and enterprises such as Google, Yahoo, Microsoft, HP, and Apple like sovereign states, on a classic map of the world. To explain the dominance and relationships of these entities, they were all given a visual hierarchy that gives prominent treatment to companies with the most users (or sites with the most visitors), surrounding them with smaller countries representing related websites and services.

This poster includes one full map of the internet, 4 minimaps showcasing NSA surveillance, most used social networks, most used internet browser, and worldwide internet penetration, list of Alexa Top 500 websites, quick timeline of the Internet History, top software companies and much more!

The map includes more than 250 separate websites/enterprises as sovereign states, and more than 2000 separate labels.

A high-resolution version is available online, and you can also order 24” x 36” printed posters on Zazzle.

This what I call a 2nd level design, which means it’s a highly detailed design that is meant to present a ton of information to the audience.  This type of design isn’t trying to communicate a key message in a few seconds, but is intended for readers to zoom-in and explore.

Map of the Internet 2.0 Poster Zoom


Found on Business Insider

Wednesday
Mar052014

Hungry Tech Giants

Hungry Tech Giants Interactive Infographic

Hungry Tech Giants is a cool infographic from Simply Business that is both zoomable and interactive!  To put them into context, the design visualizes 15 years of tech company acquisitions by Apple, Google, Yahoo, Amazon, And Facebook.

2013 was a busy year for tech acquisitions.

With competition in the tech space heating up, Apple, Amazon, Google, Yahoo, and Facebook collectively executed 65 acquisitions in 2013 alone.

Yahoo was the biggest acquirer of 2013, buying a total of 25 companies following the hiring of its new CEO, Marissa Meyer.

Although Meyer is best known for her acquisition of Tumblr, the majority of her deals have bought engineering talent in an effort to build Yahoo as a serious challenger to Google.

Apple also had their biggest ever year for acquisitions in 2013, with ten purchases in total.

To see all of the acquisitions in detail, please visit our interactive microsite.

Each acquisition is appropriately placed on the timeline, and shown as a circle sized to match the total acquisition price.  Solid circles shown known prices, and open circles are not sized because the acquisition amount was never released publicly.  The circles are also color-coded to represent the different categories.

The interactivity allows you to select which categories to show, and when you hover over any particular acquisition, the acquired company name is shown with a link to the press release or news story announcing the acquisition.

The zooming controls allow you to adjust the date range shown, which helps identify many of the overlapping circles.  Clicking on the company logos on the left also brings up the data table which shows all of the known values, dates and includes the links to the press releases.  A very good way to establish credibility and make your data sources transparent.

The overall design is meant to be very detailed and allow the audience to dig in and explore the data.  At the macro level, the infographic clearly puts Facebook’s $19B acquisition of WhatsApp into context as the largest tech acquisition of all time!

Found on TechCrunch and Cult of Mac!

Monday
Oct072013

The Color Emotion Guide

The Color Emotion Guide infographic

The Color Emotion Guide arranges well known company logos into a rainbow of emotion to help readers understand which logos are using color to create a perception of their brands.

Logo designers have several puzzles to solve when presented with a new logo design project. One of the main considerations that a designer must deal with is to understand what it is that the client wants to achieve with the logo design.

The designer asks the client a series of questions that illicit answers helping to bring the parts of the puzzle together. A typical question might be “What qualities does your business want to be known for?” The answer might be for a doctor for instance, “I want to be known as someone you can trust”. So the question and answer begs: How does the designer portray trust in the logo design?

Scientists have been studying the way we react to colors for many years.  Certain colors make us feel a certain way about something. As long as the designer knows what these colors and emotions are, the designer can use that information to help present the business in the right way. These are not hard and fast rules but smart designers use the information to their clients advantage.

This fun infographic lays out the emotions and qualities that well known brands like to be known for. The color psychology is only one part of the puzzle but I think you will agree it is a very important part of it.

As far as I can tell, this appears to be a design from The Logo Company, but it was very hard to track down.  Infographics are usually shared without the accompanying articles, so designs need to include basic information like their own company logo, a copyright statement and the URL back to the original design in the actual image file.

Found on Laughing Squid

Thursday
Sep052013

The Monstrous Cost of Work Failure

The Monstrous Cost of Work Failure infographic

The Monstrous Cost of Work Failure infographic from AtTask looks closely at the cost of failure within companies.  How many at-bat attempts does your company take before hitting a homerun?

Projects fail, budgets blow up, fire drills reign and chaos abounds

Work failure plagues all types of teams – from marketers working on a campaign to IT teams deploying a major software system. The root of the problem – impacting 70% of teams – is work chaos. And it can be conquered. Click on the image below to view or download the full graphic and learn more about work failure and how to avoid it.

Fun design with monster characters to help tell the story to readers.  The design does a good job telling a 3-part story to the audience:

  1. Introduction - What is the problem?
  2. The Main Event - How big is the impact?  How can this effect me?
  3. Call To Action - How do I fix the problem? 

Big fonts are not data visualizations, and in this design I would liked to see more of the statistics visualized.  Visualization would help put the data into context for the audience.  The footer of the design should also include the copyright information and the URL to the original infographic landing page so readers can see the full-size infographic.

Thanks to Matt for sending in the link!

Thursday
Jul252013

PepsiCo Q2 2013 Performance Infographics

PepsiCo has begun to publish an official infographic along with each of their quarterly earnings reports to investors and analysts.  The PepsiCo Q2 2013 Performance infographic was just released online to coincide with the press release and earning call to analysts.

I love seeing infographics used in this way, and I think we will be seeing many more of them from other companies.  Visualizaing the financial data can make the complex filings much easier for investors to understand.

As much as I love this idea, this particular design needs help visualizing the data.  Big fonts are not data visualizations, and many of the financial stististics presented were shown in text only.  It takes a data visualization to put the values into perspective for the audience, and make them easier to understand.

This is the second infographic in the series.  It appears that each one will be released with a unique website dedicated to hosting the infographic.  This on can be found at: www.pepsicoinfographicq2.com, and a PDF version is also available to download from the site.  You can find the infographic from the prior qurter here: www.pepsicoinfographicq1.com.  The infographics were also published on the PepsiCo Multimedia Downloads section of the Media page.

Thanks to Chris Hoyt for posting on Google+

Monday
Jul152013

The Investfographic

Investfographic

The Investfographic from EquipRent.com is the infographic they designed in-house to share with potential investors. Visual aids and infographics are becoming a valuable tool for companies to communicate with potential investors and shareholders.  Consider this to be a visual elevator pitch.

Using an “InvestFoGraphic” to raise capital

As a serial entrepreneur, I am always looking for an edge that makes a company standout and be noticed during capital raising times.

With the advent of new software tools like Prezi to boost your presentations, we decided to creatively put together a colorful investment infographic handout that completely complied with our goal of keeping our story concise, relevant, and exciting. The typical handout (1-page executive summary) that we had previously given VCs was heavy on words explaining in great detail what our company did and how successful we had been. This new graphic handout was riddled with bold and exciting claims about our company and our industry. The underlying theory behind using the infographic was to hook them first, grab their attention and then be ready to talk business. 

The exciting news is that we are now in final discussions with several investor groups to close our funding. We know the infographic wasn’t the main reason for getting to this final phase, but we do know that differentiating yourself makes you more memorable and shows investors you and your company plan on being different than the massess.

Remember the advice that the great Rod Stewart gave years ago:  Every picture tells a story, don’t it!

The team at EquipRent uses the design as a talking point at investor events.  They found it much easier to point out the visuals and discuss each point with their investors.  They shared with Cool Infographics, a few of the comments made by investors after seeing the design:

  • “I can quickly see what is different about this company than reading a typical one-page executive summary.”
  • “I have never seen anyone use an infographic for investor purposes,  other than to distinguish market trends.”
  • “Definitely sets you a part…like a cool and different resume.”

Thanks to Nate for sending in the link!

Monday
Jul082013

How Startup Funding Works

How Startup Funding Works infographic

How Startup Funding Works from Funders and Founders co-founder Anna Vital does a great job of visualizing the split of equity at different stages of a company’s life.

A hypothetical startup will get about $15,000 from family and friends, about $200,000 from an angel investor three months later, and about $2 Million from a VC another six months later. If all goes well. See how funding works in this infographic:

Is dilution bad? No, because your pie is getting bigger with each investment. But, yes, dilution is bad, because you are losing control of your company. So what should you do? Take investment only when it is necessary. Only take money from people you respect. (There are other ways, like buying shares back from employees or the public, but that is further down the road.)

This is a great design that uses pie charts correctly and effectively!  This is in contrast to the many designs that use pie charts inappropriately.  This is a great example of a visual explanation that uses a combination of data visualization, illustration and text to tell a clear story.

The color coding is also effective, but for some reason they didn’t color the co-founder icon character green to match his portion of the pies.  The URL link to the original infographic landing page is also missing in the footer, so it makes it hard for readers to find the full-size original version when they see it posted on other sites.  People aren’t always good about creating links back to the original, so the URL should be included in the infographic image file itself.

Tuesday
Feb122013

Visualizing AOL's Return to Growth after 8 Years

Visualizing AOL's Return to Growth after 8 Years infographic


Sometimes you only need one data visualization or chart to tell your story.  Statista recently published the infographic AOL Returns to Growth After 8 Years with only this bar chart of year-over-year revenue since Q1 2008, which clearly shows the last five years of quarterly losses.

This chart shows AOL’s revenue growth since the first quarter of 2008. In the fourth quarter of 2012, the former internet heavyweight returned to positive growth after 8 years of declining revenues.

The latest results mark a milestone in CEO Tim Armstrong’s quest to transform his company from an internet service provider into a digital media company. Since AOL’s spin-off from Time Warner in 2009, the company had acquired TechCrunch and The Huffington Post to re-position itself as an ad-selling provider of premium online content.

The above chart nicely illustrates the slow progress AOL has made in the past 2 years.

Not an infographic in the modern online interpretation of telling complete stories in one image file, but more in-line with the definition of infographics simply as “information graphics”.

I’m not sure why they didn’t show the complete 8 years of data in the chart.  By only showing 5 years of data in the chart, they really didn’t support their claim that it has been 8 years of losses for AOL.

Found on Visual Loop.

Wednesday
Jan232013

LEGO Minifigs

LEGO Minifigs infographic

The LEGO Minifigs infographic is a history of LEGO Minifigs (Mini Figures). The infographic designed by Hot Butter Studio for visual.ly includes the dates when characters were introduced or when a certain feature was added. An added bonus to the infographic is the information about female LEGO minifigs and the FRIENDS line that was designed primarily for girls.

This is a fun infographic with some interesting factoids that will keep readers engaged with the design.  LEGOs are cool right now, so the timing for this design is good.  It’s also a topic that has not been well covered in infographics, so it stands out as unique information.

I wish a few of the data points were visualized like number of minifigs sold each year or space events along an actual timeline visual.

Thanks to Karyn for sending in the link!