The Enterprise Mobility Ecosystem Map
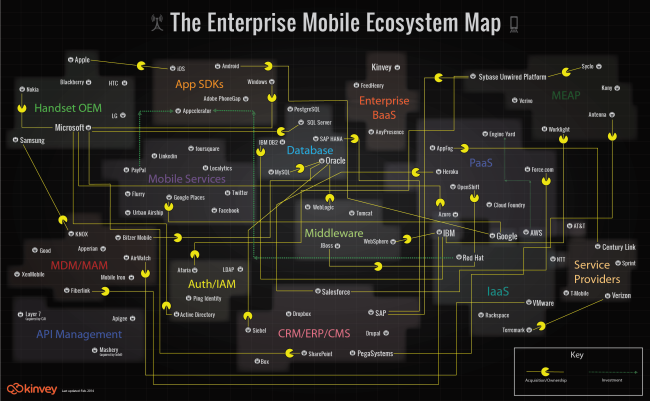
The Enterprise Mobility Ecosystem Map published by Kinvey attempts to make sense of the ownership and acquisitions rapidly taking place within the mobile backend providers. Platforms for authorization, payments, location services and software development kits (SDKs).
Enterprise mobility is a classic IT disruptor. It’s the kind of disruptor that companies like IBM, Oracle and VMware, SAP, Salesforce, etc. were built on. It may look like a peripheral part of IT infrastructure now, but since mobile will be the primary access point to apps and data for many enterprises, many — if not most — new apps are going to be “mobile first.” Thus, the entire IT infrastructure is going to have to become very mobile friendly, very quickly, or else risk becoming a legacy platform.
As a consequence, major IT vendors are partnering with or acquiring companies throughout the mobile stack. Market consolidation and investments have taken place in MDM, API Management, cloud and handset markets. To visualize this activity, we’ve produced the Enterprise Mobile Ecosystem map below.
A network map visualization like this can help companies figure out where their business plays, and how other company acquisitions around them may impact their business. I like that the design is purely informational, and doesn’t add a lot of extra data or information to the design. The message is all about the connections, and doesn’t include things like the size of the companies or the value of the acquisitions. This keeps the infographic focused on telling one story really well.
I would recommend using the company logos in the subway map style design to make it faster and easier for the audience to recognize the companies involved. It’s much harder for the readers to read all of the company names in text to find the companies they recognize.
The Pac-man icons are a nice touch to indicate the direction of ownership or acquisition.


 Randy
Randy

Reader Comments (2)