About
Randy Krum
President of InfoNewt.
Data Visualization and Infographic Design

Infographic Design

Infographics Design | Presentations
Consulting | Data Visualizations

DFW DataViz Meetup

Join the DFW Data Visualization and Infographics Meetup Group if you're in the Dallas/Fort Worth area!

Search the Cool Infographics site

Custom Search

Subscriptions:


Feedburner

The Cool Infographics® Gallery:

How to add the
Cool Infographics button to your:

Cool Infographics iOS icon

- iPhone
- iPad
- iPod Touch


Read on Flipboard for iPad and iPhone

Featured in the Tech & Science category

Flipboard icon

Twitter Feed
From the Bookstore

Caffeine Poster

The Caffeine Poster infographic

Entries in design (479)

Friday
Aug102018

Giveaway: 5W Information Graphics & Data Visualization Workshop Dallas

This month (August 2018) I'm giving away ONE FREE ticket to attend the 5W Information Graphics and Data Visualization 2-day workshop in Dallas, TX on September 13-14, 2018.

Register on the Giveaways Page by August 31, 2018 to be entered, and the winner will be chosen on September 1st!

Juan and Samuel Velasco currently have workshops scheduled in four cities across the U.S., so I'm jumping on the chance to attend and help promote the workshop in Dallas. I highly recommend you check out the schedule and attend one if they are close to you.

Monday
Jul022018

What Your Font Says About You

What Your Font Choices Say About You infographic

What Your Font Choices Say About You infographic from GetVoip is a comical explanation of why we choose what font we use.

In 1975, two Swiss designers, Max Miedinger and Eduard Hoffmann came out with the font Helvetica. Since then, it has been used on some of the biggest brands in the world, such as Verizon, 3M, Kawasaki, Jeep, Tupperware, Target, Panasonic, and Apple.

What is it that makes this font and others so alluring?

For most of us, unless you are a designer in some capacity, the font choice on reading materials is overlooked or completely ignored. But there may be something that still triggers in the subconscious that helps you recognize a good font. In one study at MIT, subjects were found to be in a better mood after reading something with “good” typography. The subjects also saw improved performance in certain cognitive tasks after reading the “good” typography instead of the bad.

Today, there are over 33,000 fonts available on sites like MyFonts.com With so many choices, and so much at stake, how do you know which to choose? And furthermore, when choosing a font, do you know what message it might be conveying to your readers?

We put together an infographic below that looked at some of the most popular fonts of the day and provided some feedback on what message you might be sending with that font choice or style.

Whether you are drafting an important email or deciding on a font to use for your brand, you will certainly want to know how this decision will come to define you. We all have likely experienced either sending or receiving an embarrassing misspelling, grammatical error, or autocorrect failure, but choosing the wrong font can become the biggest mistake of all.

If you have ever been concerned about how you will be perceived by your choice of font, your concerns are warranted. Dan Gilbert, the majority owner of the Cleveland Cavaliers basketball team, received a maelstrom of criticism after his open letter regarding Lebron James’ move to the Miami Heat was written in the Comic Sans font.

When choosing your font it’s best to default to a standard serif or sans-serif versus a more decorative or script font, even if you are resentful that your elementary school teacher said that you would need to know cursive in life––lies!

What does using Trebuchet on the Cool Infographics site say about me? 

Thank you to Drew for sending in the link!

Thursday
Jun142018

Giveaway: Design Better Charts in PowerPoint

The giveaway for June is ONE FREE PASS to my complete class on Skillshare, 44 minutes for all 10 lessons! Students with a Free Access Link can watch the complete class for free without a Skillshare Premium Membership.

Register on the Giveaways Page by June 30, 2018 to be entered.

Skillshare is an online subscription learning community with thousands of classes on everything from business to graphic design to fashion – it’s the Netflix of learning. You can use THIS LINK to see my class and sign up and get two free months! That's plenty of time to take my class and try out a few others. Once you're a member, you have access to all of classes that Skillshare offers, and there are thousands of them.

If you're already a Skillshare member, then you already have access! Please check out my class, and share with your network of friends and co-workers. Follow me on Skillshare to catch any future class I post as well!

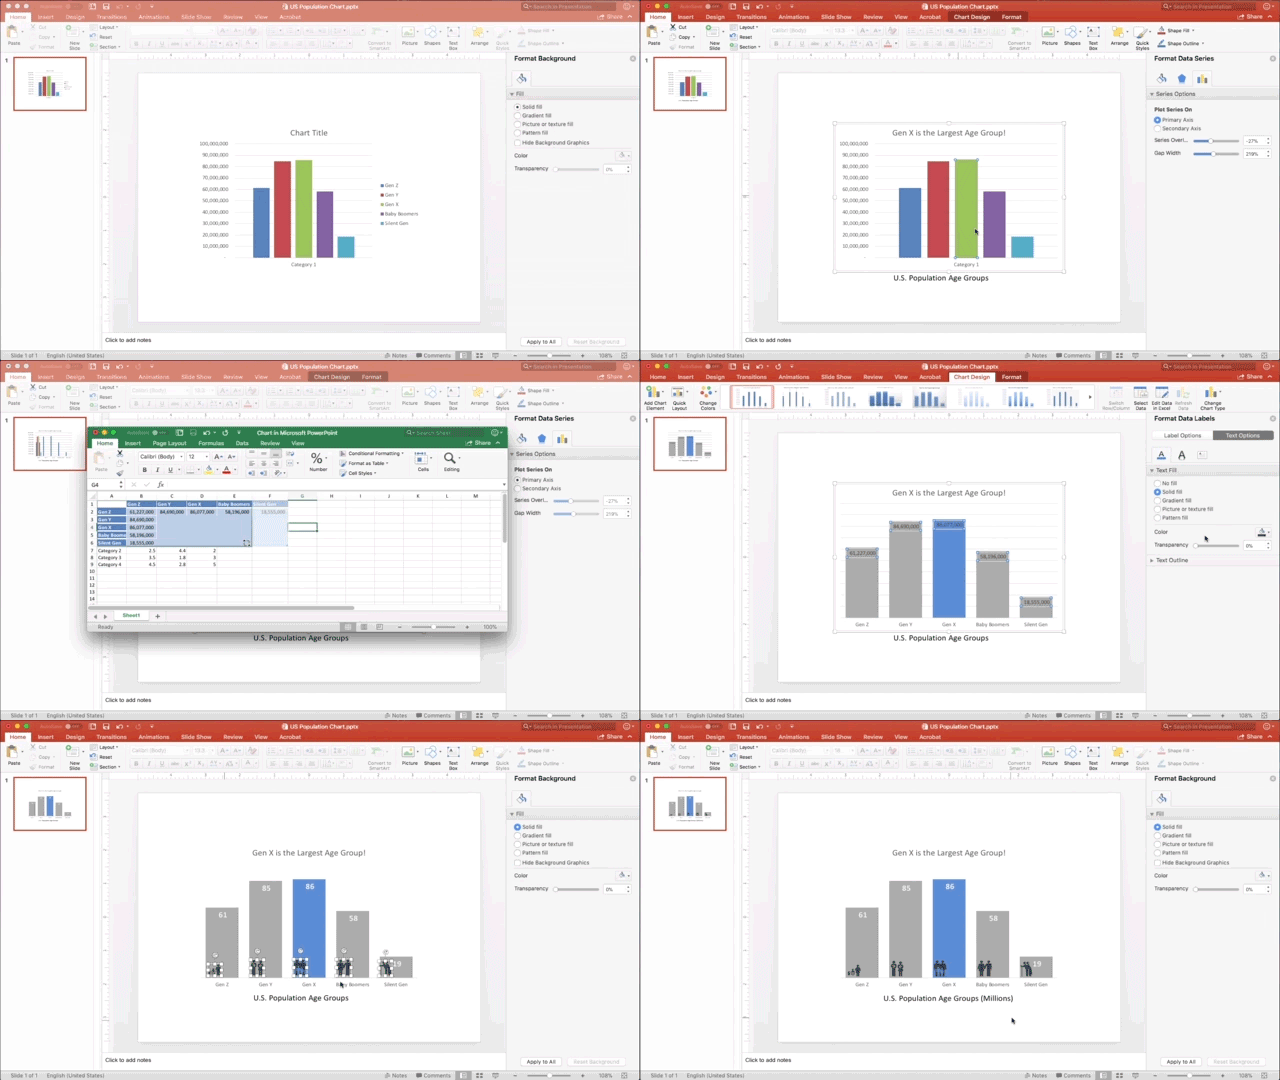
Here's a quick time lapse of the sample file I use for demonstration in the class. This will give you an idea of how the data visualization design principles are applied to a bar chart in PowerPoint:

Tuesday
Feb202018

Aflac Brunch Commercial #BadDataViz Error

Pancakes ≠ Eggs!

This commercial really bugs me! When you visualize information, you need to get the data visualization right! Don't tell people that Aflac is like the pancakes, and then highlight the eggs in the data visualization!

This comes from the shortened version I've seen through the CBS app of this longer commercial, which doesn't make this error. The long commercial is fine.

Whoever shortened this commercial, just didn't care enough to get it right!

Sunday
Jan282018

Design Better Charts in PowerPoint Class on Skillshare

This week I launched my first class on the Skillshare platform. Data Visualization: Design Better Charts in PowerPoint is a 10-lesson class covering how to apply data visualization design principles specifically to the default charts created in Microsoft PowerPoint. Too many people click the chart button and think they're done!

If you know of anyone else that’d be interested to learn how to Design Better Charts in PowerPoint, I’d appreciate if you’d share the link with them too. Thanks!

Class Description:

Most PowerPoint charts suck! Your company spends a huge amount of time and resources on research and data analysis, but when it comes time to present your results, the default charts from PowerPoint are nothing special. Learn how to apply core data visualization design principles to create charts that clearly make your audience go “Ah-Ha!”

If you’re just using the default chart templates in PowerPoint, you’re making a big mistake. Your charts will look like the same default charts your audience sees in every other presentation, and it makes you and data look generic. Those default chart are only meant to be the starting point (you have to start somewhere), but you need to customize your charts to effectively communicate your own insights and key message to your audience in a unique, memorable way.

This course will focus applying data visualization design best practices to charts created in Microsoft PowerPoint. 

  • Choose a Key Message
  • Write a Good Title
  • Remove the Chart Legend
  • Reduce Visual Noise
  • Use Color with Purpose
  • Add Chart Elements

If you’re not familiar, Skillshare is an online subscription learning community with thousands of classes on everything from business to graphic design to fashion – it’s the Netflix of learning. You can use THIS LINK to see my class and sign up and get two free months! That's plenty of time to take my class and try out a few others. Once you're a member, you have access to all of classes that Skillshare offers, and there are thousands of them.

If you're already a Skillshare member, then you already have access. Please check out my class, and share with your network of friends and co-workers. Follow me on Skillshare to catch any future class I post as well!

Here's a quick timelapse of the sample file I use for demostration in the class. This will give you an idea of how the data visualization design principles are applied to a bar chart in PowerPoint:

I want to thank Skillshare for inviting me to record the class, and the support they provided for planning, editing and promoting the class.

I have more video projects and big news to announce planned for this year, so stay tuned!

Friday
Jan192018

Ikigai - Visualizing the Japanese Concept of Life's Purpose


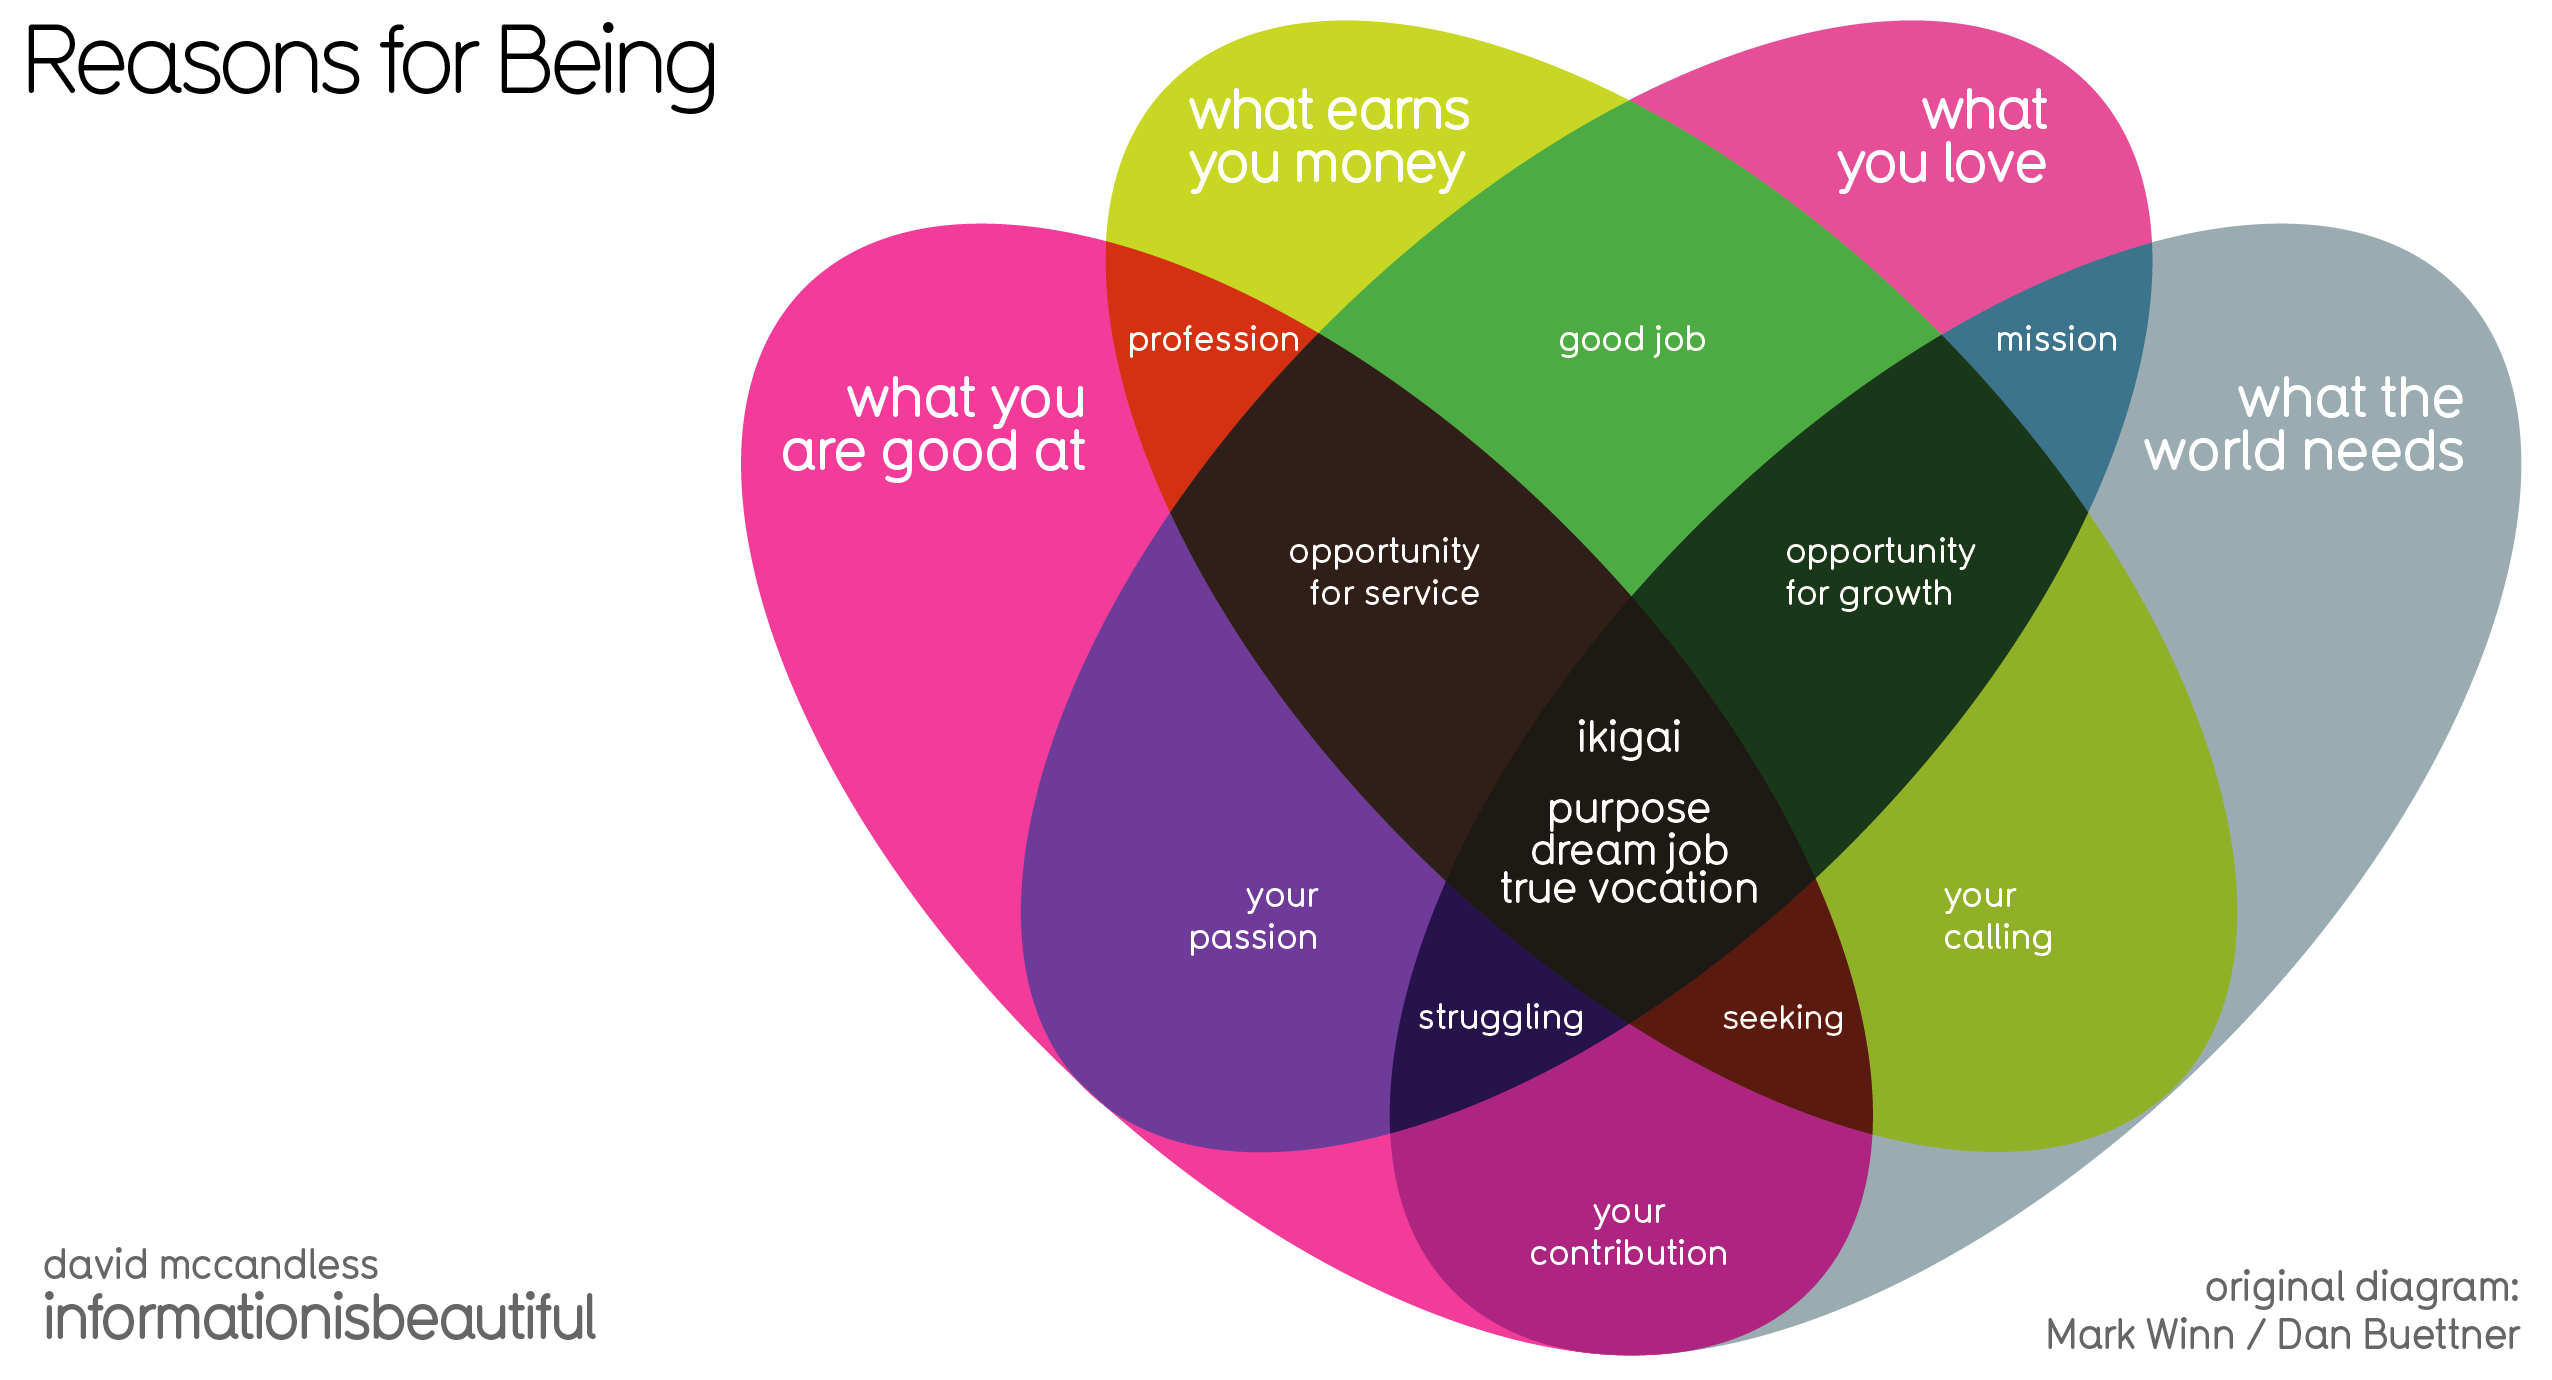
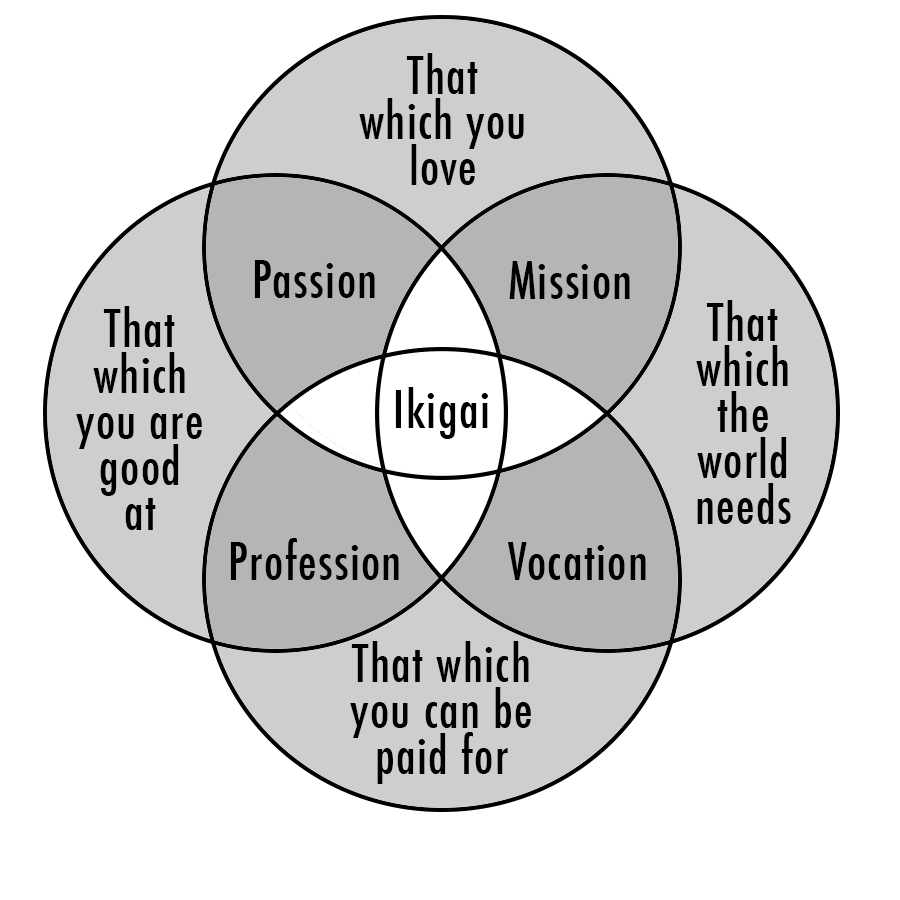
Ikigai is a Japanese concept that explains how a person can enjoy life. To illustrate this concept, a 4-sided Venn diagram was created by Dan Buettner (below), showing what it takes for one to discover their own. However, David Mccandless saw the original diagram and found it flawed. Above, we have his version of Ikigai- Japanese concept to enchance work, life & sense of worth diagram where he has theorized what should be inserted in the missing gaps, as well as giving the sections different sizes to more accurately represent the importance of each.

Ikigai is an interesting self-development concept from Japan, a prism for potentially seeing how to bring satisfaction, happiness & meaning to life. The direct translation is the “happiness of being busy.”

The original diagram was created by British community activist Marc Winn in 2014 from a TED Talk on Longevity by writer Dan Buettner.
 

Sadly, pedantically, the four-way Venn in the diagram is broken, from a technical POV. If you look closely, two sectors – love & paid for, good at & world needs – don’t intersect uniquely.

So I fixed that and theorised what those missing sectors might contain, while making a few other tweaks.

Got stuck a bit with “what the world needs” category which has a touch of entrepreneurial zeal about it. Not everyone can impact ‘the world’. But couldn’t come up with a variation that worked.

What’s interesting is that two intersections make something positive – passion, mission etc. But three intersections create a discomforting pinch point i.e. if you good at something, it’s what you love and what the world needs, but doesn’t earn you money, you’re “struggling”.


Found on Information is Beautiful

Friday
Jun232017

The Big Book of Dashboards!

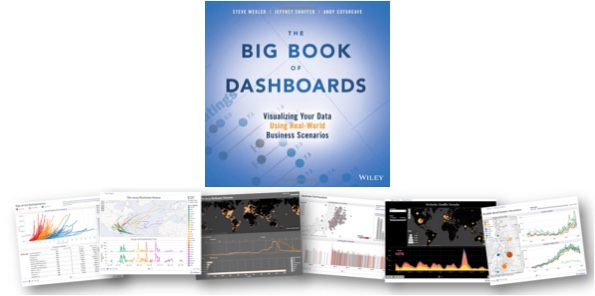
The Big Book of Dashboards is a fantastic new book release in 2017 co-authored by Steve Wexler, Jeffrey Shaffer, and Andy Cotgreave. Published by Wiley, the book is available in print and ebook. You can check it out here on Amazon!

The book starts with good data visualization design practices and then dives into 28 case studies of real dashboard designs in practice. The case studies are design tool agnostic, covering good dashboard designs from a variety of design tools. It doesn't matter what software you use, you will find inspiration and great examples in this book!

I met the co-authors at this year's Tapestry Conference, and interviewed them about the book below.

This month (June 2017) I'm giving away one copy to a lucky winner!  Register on the Giveaways Page by June 30th to be entered.


Who is the book intended for?

Steve Wexler: Anyone tasked with building or overseeing the development of business dashboards.


The three of you are in distant locations from each other. What was your process to collaborate on writing the book?

Steve Wexler: It wasn’t just the three of us!  While we were the authors, the book has 17 contributors and we would have web-sharing sessions with all of them so we could understand the rationale behind the dashboards.  There were also many cases where we would ask them to either defend their decisions or make some refinements.

In any case, we web-conferenced and relied very heavily on Slack to handle asynchronous collaboration.  The slack channels are massive (you should see all the discussions on the definition of the dashboard).

Andy Cotgreave: We also used Join Me for teleconferencing and Dropbox for file sharing. Looking back, it’s incredible how technology facilitates close collaboration across the world. 


How do you define what is a dashboard?

Steve Wexler: A dashboard is a visual display of data used to monitor conditions and / or facilitate understanding. Yes, it’s a broad definition.

Jeff Shaffer: There were long discussions on this one. We really considered Stephen Few’s definition, but picked apart terms like “single screen” and “monitored at a glance”. For example, does printing a dashboard and taking it into a meeting disqualify it from being called a “dashboard”? We think it’s still a dashboard and while it may not be used to monitor something in that instance, it does facilitate understanding. Another example is a “dashboard” that is presented on a tablet or phone where scrolling off a single screen is necessary. Technology, and screen size, is constantly changing, so while our definition is broad, I find it more accurate.


Why should dashboards be elegant or visually appealing?

Steve Wexler: I guess for the same reason that your want a computer, phone, appliance, etc., to be elegant or visually appealing.  For certain, the dashboard must first be functional (i.e., inform, enlighten, and engage) but the “engage” part is more likely if the experience with the dashboard is pleasant.

Andy Cotgreave: You need people to engage with a dashboard. Don Norman defines success according to three levels of processing: Visceral, Behavioural and Reflective. Each needs to succeed. The first response is Visceral - it’s an instant emotional reaction to whether you like something. It takes little effort to ensure the colours, fonts, layout of a dashboard is appealing, but it’s vital to get that visceral response right. The “functional” part comes next, in the behavioural level.


Do dashboards have a size limit? How large can they go?

Steve Wexler: They should be bigger than a bread box and smaller than the Empire State Building. Goodness, it depends on so many things -- the audience, the platform (desktop vs. tablet vs. mobile) and so on.

Looking at the 28 scenarios in the book, with the exception of the Financial Times Economy at a Glance dashboard, none of the desktop-based dashboard have any scrolling (many of the mobile-dashboard do provide for scrolling).  

As for the number of distinct charts on a dashboard the examples run from as few as one to around a dozen.

Interestingly, two of the examples that have a dozen or so charts are from Dundas, but because they are elegant and visually appealing you don’t feel overwhelmed by them.

Andy Cotgreave: Traditionally I’d have said they should fit on a single screen. But as mobile takes over, I think that is changing. The Financial Time Economies at a Glance dashboard is very very tall and designed for scrolling. It works extremely well on mobile. A starting rule of thumb would be to try to keep everything on one page.


How do you address the challenge of choosing the right type of chart for a given data set?

Steve Wexler: That is the raison d'être for the book! Given a particular predicament / scenario, and given the data you have, what is the chart or combination of charts that shine the most, brightest light on the subject?  That’s what we’re trying to do.

And very often that chart or combination of charts may not be what you expect.  Andy wrote a terrific chapter on visualizing time and shows there are so many cases where you don’t want to use a line chart.

Jeff Shaffer: It all starts what you are trying to show with the data. Presenting time is a great example. We have an entire chapter devoted to the different ways to show time, i.e. data over time. Typically a line chart would be a great way to show trend over time, but there are many other ways to visualize time.


What are the key mistakes people make in their dashboards?

Steve Wexler: Too much clutter and not enough clarity.  Plus we’ll often see people putting too much emphasis on decoration and not enough on information.

Jeff Shaffer: The misuse of color. People using color incorrectly or in an overwhelming way. We talk in depth about this in the opening chapter and throughout the book in many of the examples.


What advice would you give young professionals just getting started with visualizing data?

Steve Wexler: Seek feedback when building dashboards.  You need to meet with your audience, often, to make sure what you’re building actually helps the intended audience. 


What’s available for readers on the bigbookofdashboards.com site?

Steve Wexler: There are links to articles, podcasts, and workshops.  We’re also posted downloadable versions of many of the dashboards featured on the book.


Where can people follow all of you online?

Jeff Shaffer -- @highvizability, www.dataplusscience.com
Andy Cotgreave -- @acotgreave, gravyanecdote.com
Steve Wexler, @vizbizwiz, www.datarevelations.com


Are there any events coming up related to the book?

 Steve and Jeff are offering a workshop in Atlanta on June 14  and will be offering more workshops throughout the year (See http://bigbookofdashboards.com/workshops.html)

Andy, Jeff, and Steve will be offering a free webinar on how to build world-class business dashboards on June 21.  (See https://www.tableau.com/learn/webinars/big-book-of-dashboards)

We will all be at the Tableau Conference in Las Vegas, presenting sessions, and signing books!


Tuesday
Apr182017

Big Data Bootcamp in Dallas May 5-7

I'll be giving my talk "What is Good DataViz Design?" at the Big Data Bootcamp in Dallas, May 5-7, 2017 at the Irving Convention Center. There will be other fantastic speakers as well, including Barrret Clark, author of the Data Visualization Toolkit, which is this month's giveaway!

For anyone interested in attending the entire event, get $200 OFF your registration cost by using the discount code DFWDATAVIZ and this LINK. The discount is good for registrations until April 27th.

Monday
Apr172017

Interview about DataViz & Infographics Design


Expert Interview – Data Visualization & Infographics

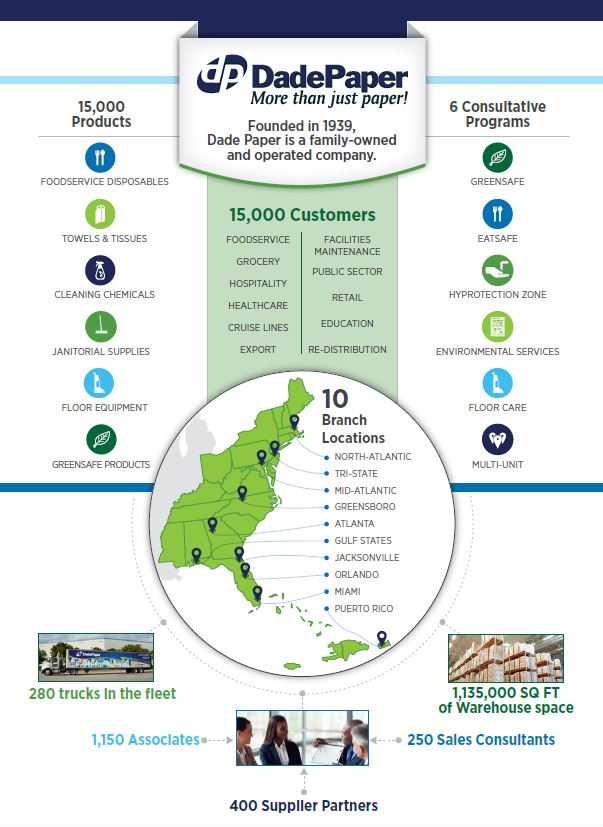
Last week I was interviewed for a new article by Dade Paper all about Data Visualization and Infographics design. The interview covered some of the best reasons to use infographics for marketing and advice for anyone that wants to start using infographics as a part of their marketing strategy.

Check out the full interview HERE 

Wednesday
Mar292017

Visualising The Beatles Signed Book Giveaway

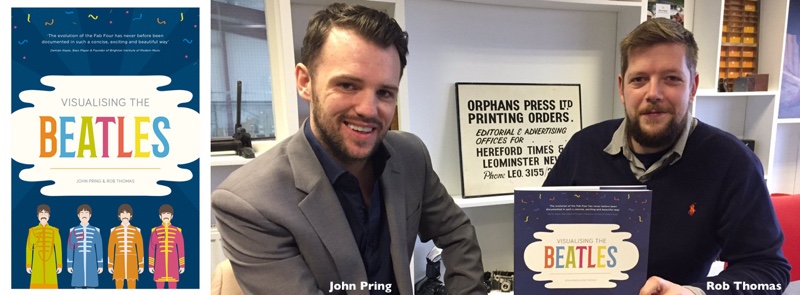
Don't miss your chance to register for the Giveaway in March! I have one SIGNED COPY of the new infographics book Visualising The Beatles by John Pring and Rob Thomas!

Register below by 11:59pm CT on March 31, 2017 to be entered. A winner will be randomly selected on April 1st.

This is the story of the Beatles told as never before.

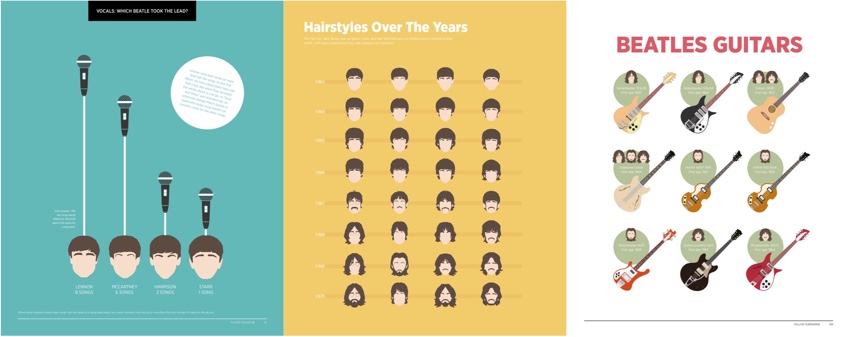
Explored visually, through stunning infographics and data visualisations, this book takes you on a vibrant ride through the Beatles years – from their first Cavern Club gig to the release of Let It Be.

Presenting unique, witty and surprising facts and stories, covering everything from their style to plans
for a Beatles Island, Visualising the Beatles charts how four young men evolved into one of the world’s greatest bands. It also includes beautiful visuals created from the data their music left behind, divided by album, to allow you to spot, in an instant, the patterns, anomalies and changes in the band’s lyrics, instruments, songwriting and performances.

The perfect gift for any fan of the Beatles or infographics.