About
Randy Krum
President of InfoNewt.
Data Visualization and Infographic Design

Infographic Design

Infographics Design | Presentations
Consulting | Data Visualizations

DFW DataViz Meetup

Join the DFW Data Visualization and Infographics Meetup Group if you're in the Dallas/Fort Worth area!

Search the Cool Infographics site

Custom Search

Subscriptions:


Feedburner

The Cool Infographics® Gallery:

How to add the
Cool Infographics button to your:

Cool Infographics iOS icon

- iPhone
- iPad
- iPod Touch


Read on Flipboard for iPad and iPhone

Featured in the Tech & Science category

Flipboard icon

Twitter Feed
From the Bookstore

Caffeine Poster

The Caffeine Poster infographic

« Top Reasons Startups Fail | Main | Abita Beer Release Calendar 2018 »
Friday
Jan192018

Ikigai - Visualizing the Japanese Concept of Life's Purpose


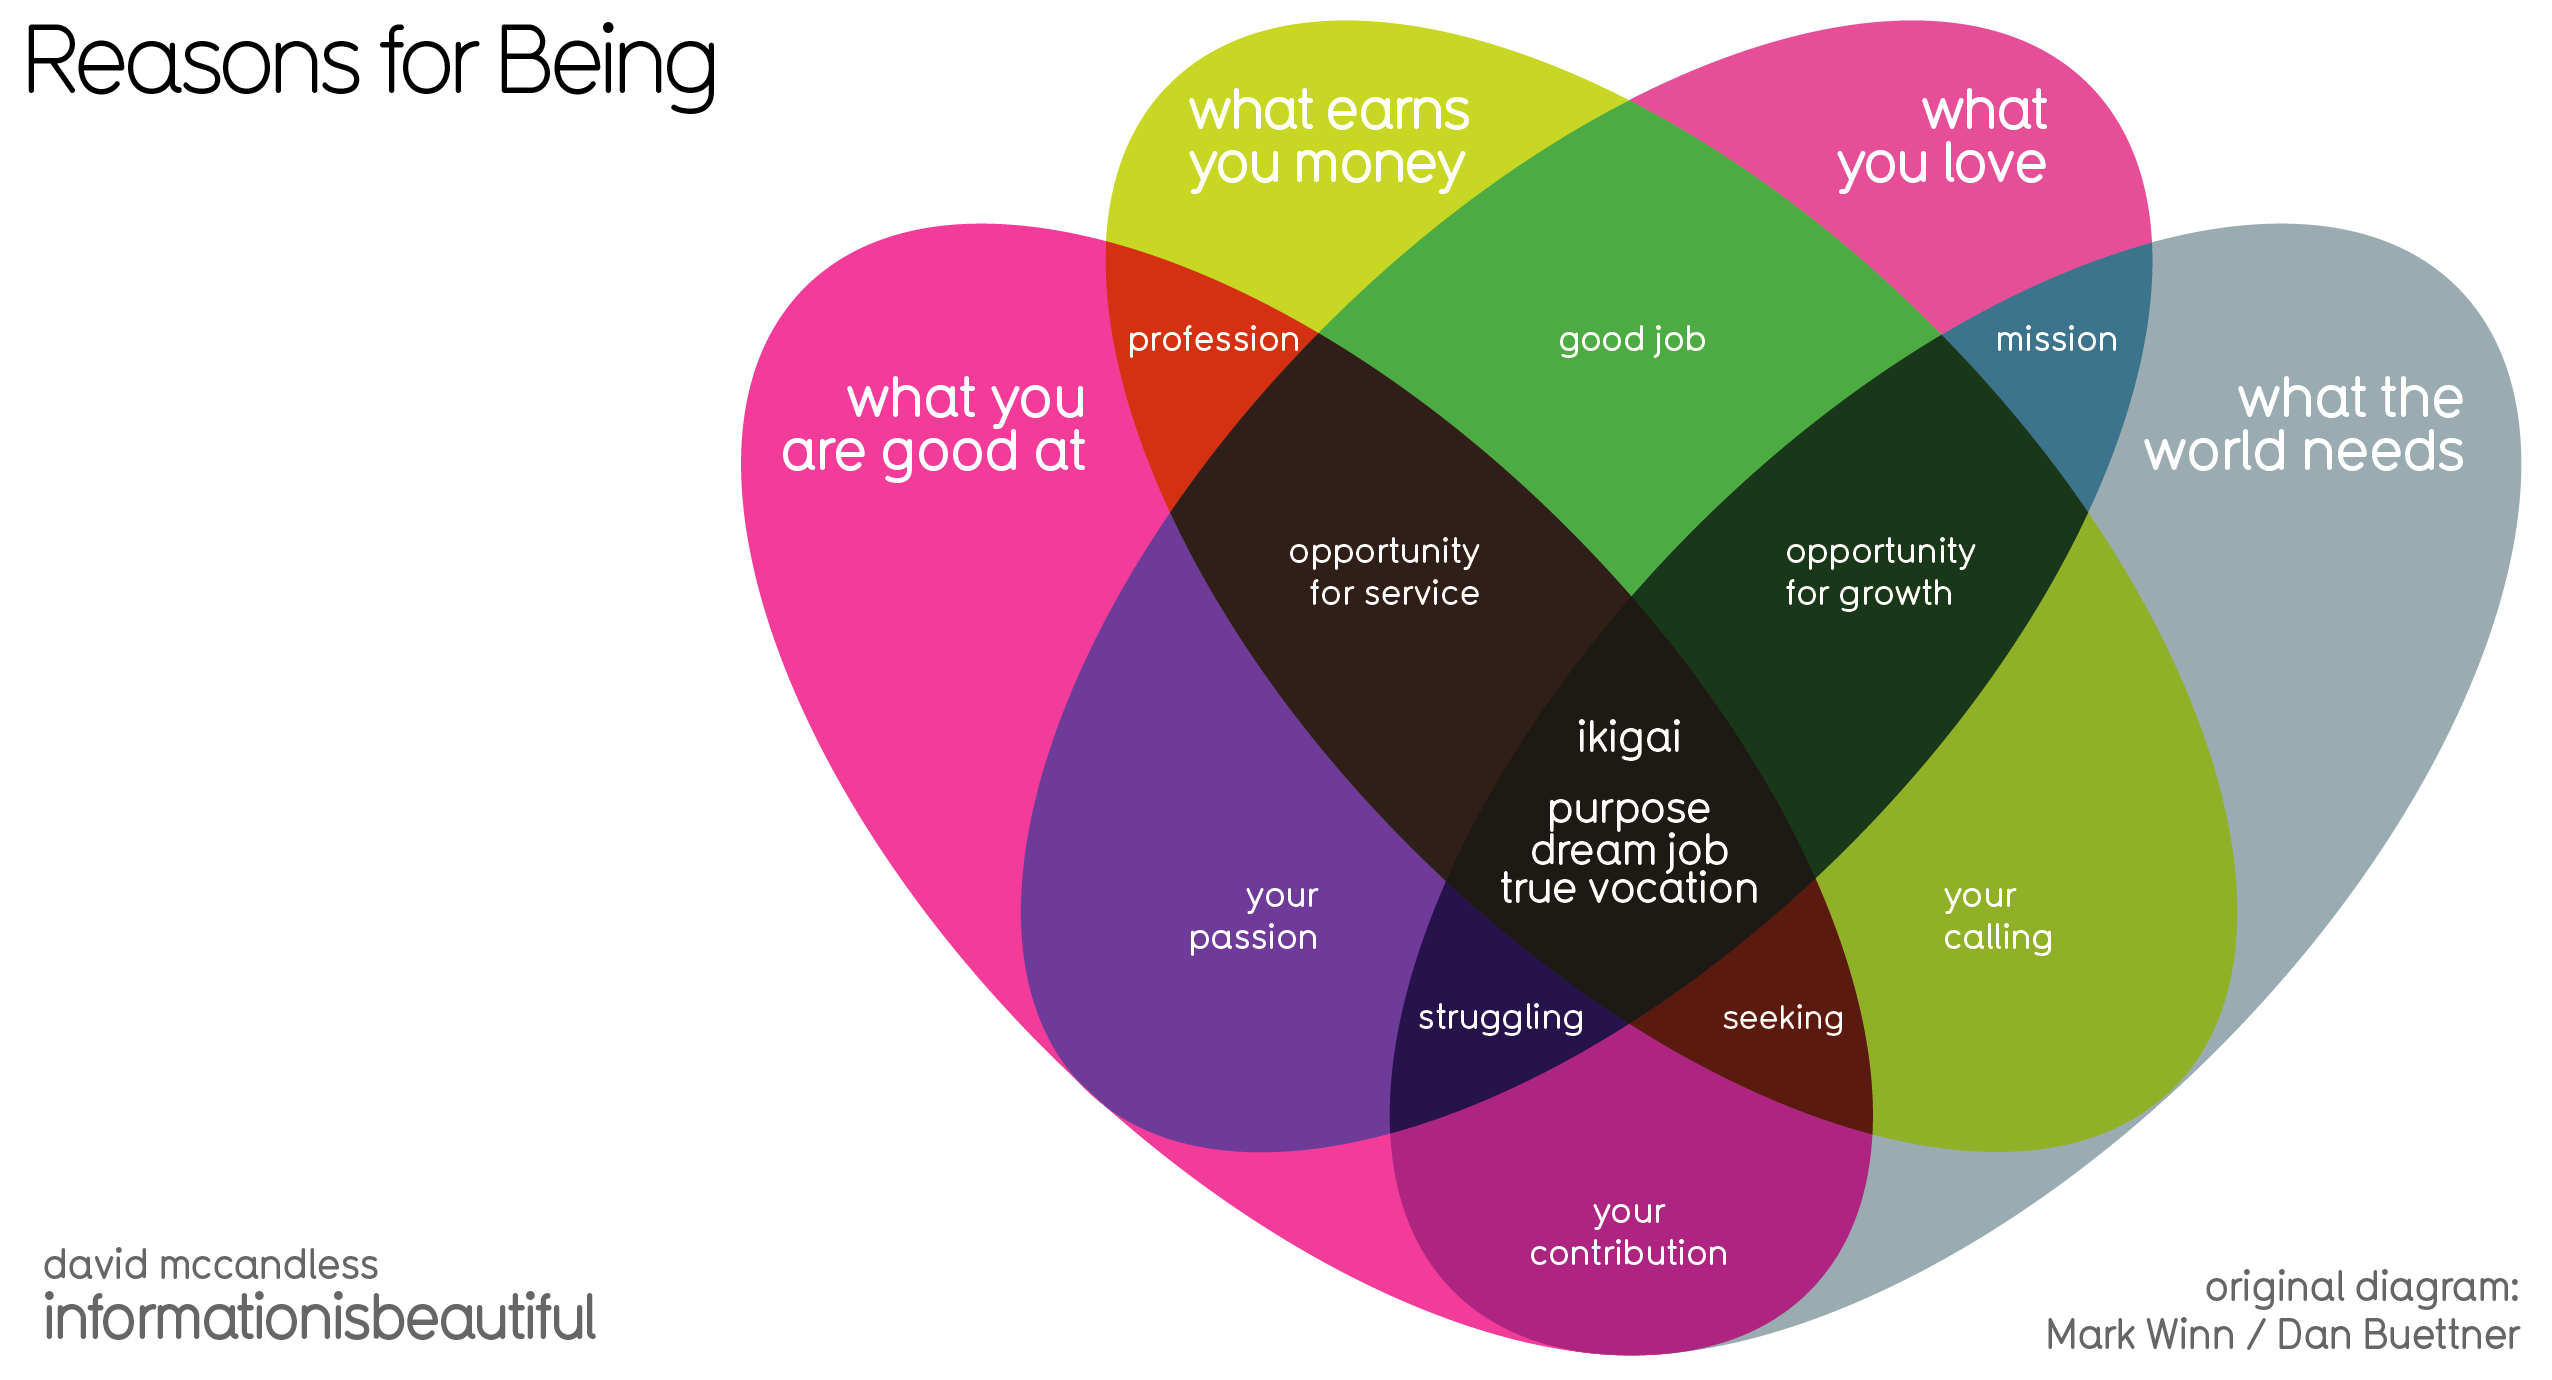
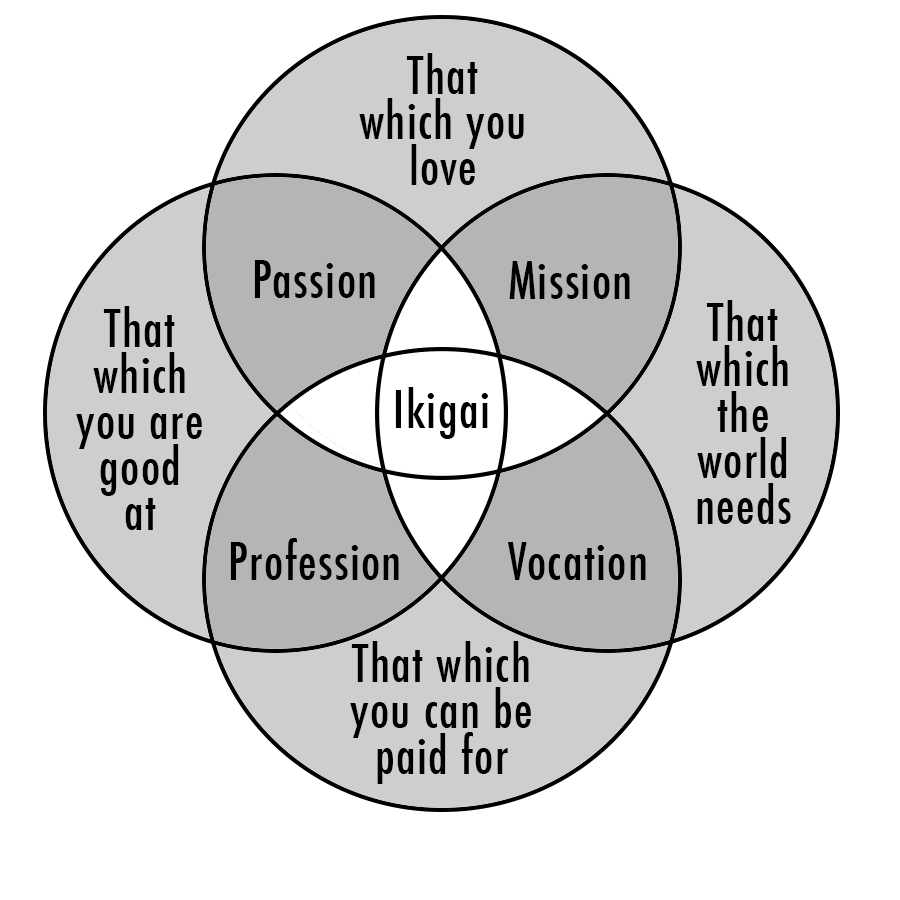
Ikigai is a Japanese concept that explains how a person can enjoy life. To illustrate this concept, a 4-sided Venn diagram was created by Dan Buettner (below), showing what it takes for one to discover their own. However, David Mccandless saw the original diagram and found it flawed. Above, we have his version of Ikigai- Japanese concept to enchance work, life & sense of worth diagram where he has theorized what should be inserted in the missing gaps, as well as giving the sections different sizes to more accurately represent the importance of each.

Ikigai is an interesting self-development concept from Japan, a prism for potentially seeing how to bring satisfaction, happiness & meaning to life. The direct translation is the “happiness of being busy.”

The original diagram was created by British community activist Marc Winn in 2014 from a TED Talk on Longevity by writer Dan Buettner.
 

Sadly, pedantically, the four-way Venn in the diagram is broken, from a technical POV. If you look closely, two sectors – love & paid for, good at & world needs – don’t intersect uniquely.

So I fixed that and theorised what those missing sectors might contain, while making a few other tweaks.

Got stuck a bit with “what the world needs” category which has a touch of entrepreneurial zeal about it. Not everyone can impact ‘the world’. But couldn’t come up with a variation that worked.

What’s interesting is that two intersections make something positive – passion, mission etc. But three intersections create a discomforting pinch point i.e. if you good at something, it’s what you love and what the world needs, but doesn’t earn you money, you’re “struggling”.


Found on Information is Beautiful

PrintView Printer Friendly Version

EmailEmail Article to Friend

Reader Comments (7)

A round of applause for your blog post. Really thank you! Keep writing.
January 23, 2018 | Unregistered CommenterJohn Smith
Great proposition.
Can i translate it in french with your name under the chart ?
February 27, 2018 | Unregistered CommenterFlorence Glouche
You need to reach out to David McCandless at InformationIsBeatutiful.net to get permission from the original designer.
February 27, 2018 | Registered CommenterRandy
I’ve recently read a book on this. It’s a great concept and one we can all benefit from adopting. It’s a bit of a mindset change for most in today’s western society however. But certainly worth pursueing for happiness and longevity.
March 25, 2018 | Unregistered CommenterMary-Anne
Wow... this is a really good version of the diagram. a 2.0!! Nice work!
April 25, 2018 | Unregistered CommenterGoh
Really great. Can I translate it in Dutch and use it with your name?
September 6, 2018 | Unregistered CommenterDiane Smets
You'll have to ask David McCandless and the team and InformationIsBeautiful.net for permission
September 6, 2018 | Registered CommenterRandy
Editor Permission Required
While we are migrating to a new site design, you must have editing permission for this entry in order to post comments.