About
Randy Krum
President of InfoNewt.
Data Visualization and Infographic Design

Infographic Design

Infographics Design | Presentations
Consulting | Data Visualizations

DFW DataViz Meetup

Join the DFW Data Visualization and Infographics Meetup Group if you're in the Dallas/Fort Worth area!

Search the Cool Infographics site

Custom Search

Subscriptions:


Feedburner

The Cool Infographics® Gallery:

How to add the
Cool Infographics button to your:

Cool Infographics iOS icon

- iPhone
- iPad
- iPod Touch


Read on Flipboard for iPad and iPhone

Featured in the Tech & Science category

Flipboard icon

Twitter Feed
From the Bookstore

Caffeine Poster

The Caffeine Poster infographic

Entries in brand (49)

Tuesday
Sep192017

40 Facts About the Psychology of Color

40 Facts About How the Psychology of Color Can Boost Your Website Conversions infographic

Color has always been a determining factor in a consumer's decision to buy a product. But with today's online shopping market, color decision is even more important than ever. It takes a consumer 90 seconds to make a product assessment and Marketing Profs says that 62%-90% of this judgment is based on product color alone! The 40 Facts About How the Psychology of Color Can Boost Your Website Conversions infographic outlines popular uses for the colors as well as some of the brands that use them. They have also included popular colors for specific shoppers like impulse buyers.

The infographic breaks down the rainbow and explains emotions associated with each hue, as well as in which industries each color is popular, and in which industries each color is not recommended.

For example, white and silver signify perfection, and you can see that in brands like Apple and Ralph Lauren, but many food brands—which prefer characteristics such as energy or excitement—opt for brighter colors.

Furthermore, certain colors speak to the psychology of certain types of buyers, according to the infographic. For example, navy blue and teal are often used to target budget shoppers, whereas pink, rose, and sky blue speak to traditional clothing buyers.

Notice how some of the statistics are visualized and others are just shown in text alone. The non-visualized data is perceived as secondary information or footnotes to the more prominent visualized data.

I also think they overuse the Radial Bar Chart style of visualizing data. I'm not a big fan of these since they are harder for readers to understand the comparisons.

Found on https://www.marketingprofs.com

Monday
Oct052015

The Power of Visual Branding

The Power of Visual Branding infographic

Whenever you are trying to connect with a consumer, there are many factors to keep in mind. The Power of Visual Branding infographic from Silicone Wristbands Direct discusses how to successfully use promotional materials to connect with your target audience.

Top Tips for Making Visual Branding a Success!

When it comes to marketing and promotion, visual branding is vastly important, whether it is for a business, charity or even an individual product.

Silicone wristbands are a huge part of visual marketing and have been proven to have an excellent effect throughout the world, however, to make them work for you and your promotion it is important that you consider the visual qualities of your marketing products. This is why we have created this brand new infographic below that includes the best tips for making visual branding work for you!

Good explanation of the thought that goes into the products in their business market. Silicone wristbands are their business, and one of the wearables mentioned in the infographic. However, the infographic is very informative for anyone in the wearables market, which makes it highly shareable.

The footer should include both a copyright (or Creative Commons) license and the URL link directly to the infographic landing page. Most infographics include only the link the company's home page (like this one), but that makes readers have to search the site to find the original, full-size infographic the company published. 

Thanks to Karen for sending in the link!

Friday
Apr112014

Color, Value, and Evolution of Logos

Color, Value, and Evolution of Logos infographic

Logos are very important to a business. A good logo can sell itself, especially if the colors match the product correctly. Color, Value, and Evolution of Logos infographic found on Finances Online.

Do you know how colors influence your buying decisions? Why the charging bulls in the Red Bull logo are red? Or why McDonald’s double arches are yellow? It’s because the emotional power of logos is closely tied to specific colors.

It turns out, our emotions are results of the precise science of effective logo design. In fact, psychologists proved that famous logos are so wired into our brains, that at the age of 2 kids can already link a product with its logo in 67% of cases. You can find even more interesting facts about logos in our latest 

The meaning behind logo colors is always a popular infographic topic, and you can see some prior posts here.  This design goes a bit further by also looking at brand values, the cost to design some of the more famous logos and how some logos have evolved over the years. 

Some portions of the design are too visually busy, and hard for the reader to follow.  Too many different fonts makes the information hard to read, and too much text detracts from the appeal of the visuals.  However, showing the actual logo images is key to sharing this information, and they do a good job of including relevant examples.

I really like that they added a few “Tweetable Facts and Figures” on the landing page below the infographic to help encourage readers to share the infographic.  They even have convenient “Tweet This” links that will fill in the Twitter post with the text for the user. 

Thanks to Alex for sending in the link!

Monday
Oct072013

The Color Emotion Guide

The Color Emotion Guide infographic

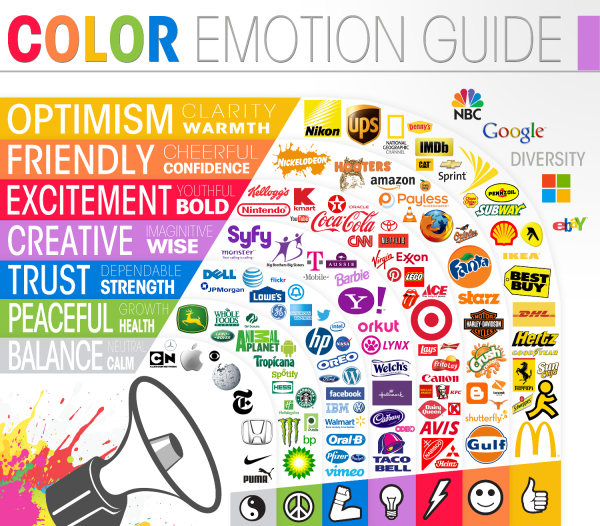
The Color Emotion Guide arranges well known company logos into a rainbow of emotion to help readers understand which logos are using color to create a perception of their brands.

Logo designers have several puzzles to solve when presented with a new logo design project. One of the main considerations that a designer must deal with is to understand what it is that the client wants to achieve with the logo design.

The designer asks the client a series of questions that illicit answers helping to bring the parts of the puzzle together. A typical question might be “What qualities does your business want to be known for?” The answer might be for a doctor for instance, “I want to be known as someone you can trust”. So the question and answer begs: How does the designer portray trust in the logo design?

Scientists have been studying the way we react to colors for many years.  Certain colors make us feel a certain way about something. As long as the designer knows what these colors and emotions are, the designer can use that information to help present the business in the right way. These are not hard and fast rules but smart designers use the information to their clients advantage.

This fun infographic lays out the emotions and qualities that well known brands like to be known for. The color psychology is only one part of the puzzle but I think you will agree it is a very important part of it.

As far as I can tell, this appears to be a design from The Logo Company, but it was very hard to track down.  Infographics are usually shared without the accompanying articles, so designs need to include basic information like their own company logo, a copyright statement and the URL back to the original design in the actual image file.

Found on Laughing Squid

Monday
Dec242012

Evolution of the Batman Logo

Evolution of the Batman Logo infographic

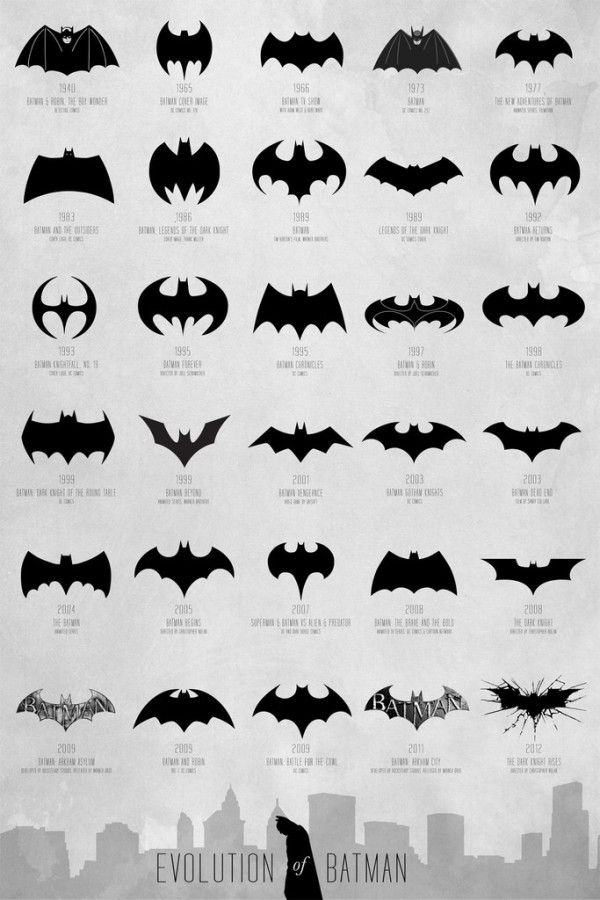
The Evolution of Batman poster designed by Cathryn Lavery from Calm the Ham is a visual history of the Batman symbol over the years.  I can’t think of any consumer logo that has changed this much, but the Batman logo remains a very powerful and recognizable brand.

A comprehensive and extensive chart of the Batman logo evolution, spanning over 72 years from 1940 - 2012 to map the transformation of a timeless hero.  Thanks to DC Comics for creating this cultural icon that we can all obsess over, all logos belong to them.

The infographic timeline covers 72 years (1940-2012) and shows different version of Mr. Wayne’s logo so the reader can easily distinguish the different iterations.  Additional information like the year and media publication format are listed in text.  I would have liked to see them spaced out along an actual timeline, but this design format fits better on a standard poster.  Three different size posters are available from the Calm the Ham site.

I found this design on the FastCoDesign site, but a few other designers have also tackled this specific history.  Cathryn Lavery mentions this 2008 video from Rodrigo Alejandro Rojas Sandoval as being the first one she knows of that had attempted this:

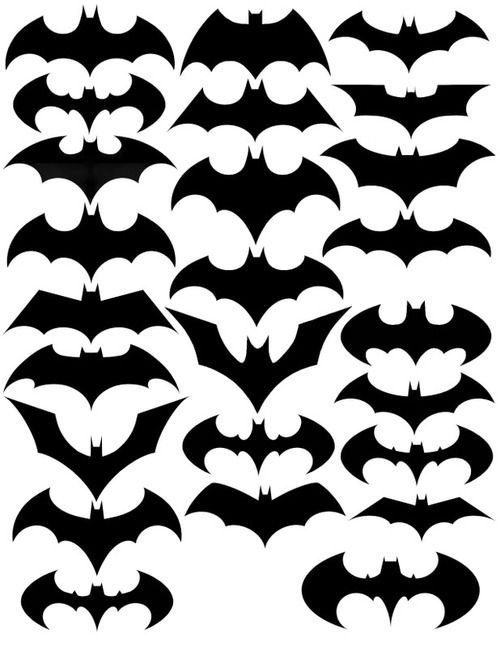
I saw this design on Nathan Yau’s FlowingData site in 2010, but he wasn’t able to cite the original source.  This one shows fewer versions, and doesn’t include any additional information.


Monday
Dec172012

Facebook’s Network of Worldwide Affiliates

Facebook's Network of Worldwide Affiliates infographic

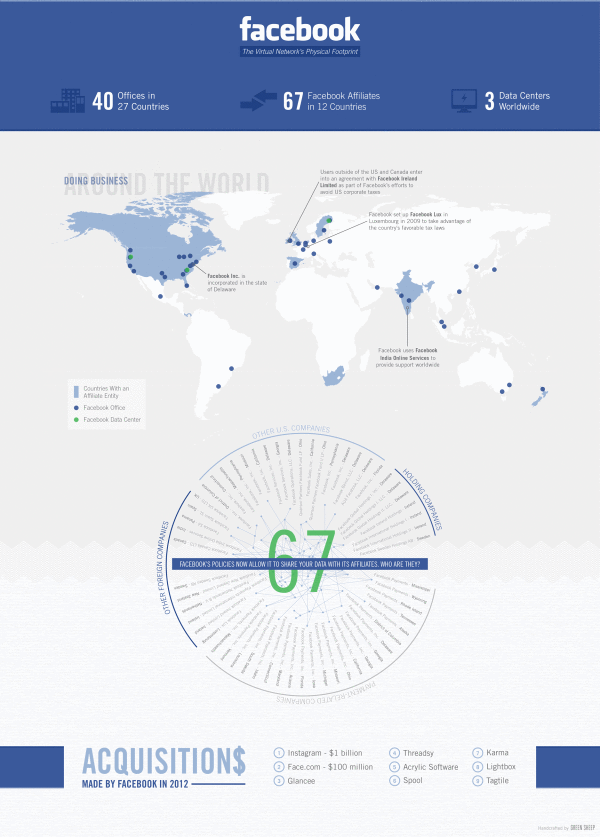
From BusinessProfiles.com, this Facebook infographic takes a look at the complex virtual network of affiliates behind Facebook.

Earlier this week, Facebook’s proposed revisions to its legal agreements with users went into effect following a vote by the social network’s users. One of the changes means that Facebook can now share your data with its affiliates. But who exactly are Facebook’s affiliates? Most of the media coverage has focused on Instagram. But Business Profiles research can now reveal that Facebook has at least 67 Facebook affiliate companies worldwide. The results are summarized in today’s infographic.

I like this design, and it has some great information about what Facebook’s legal agreements really mean to members.  It’s a focused story that isn’t trying to tell the reader too much information.  The color scheme is so close to the official Facebook brand colors and design that it could easily be misunderstood as an official publication, which it isn’t.

The lack of clear title makes this infographic design hard to share.  Anyone that posts a link has to make up a related title, which will be very inconsistent.  The lack of clear title, also makes it more challenging for a reader to know why they should take the time to read the infographic.  The risk is being considered “just another infographic about Facebook” and ignored by readers.

The map data is clear and easy to read.  The affiliate connects are the most interesting part of this design.  When the privacy policy says they can share you personal information with Facebook Affiliates, this is who they actually mean.

We sourced this information from our own extensive corporate registration directory as well as from other public and subscription sources. Please note that not every jurisdiction makes comprehensive business registration readily available. As a result, there are likely even more Facebook affiliates than those listed above. However, we hope that this gives some sense of the extensive and rapidly expanding physical footprint of the social network.

Information sources were obviously a challenge, and the statement above is included under the design on the infographic landing page.  However, there is no Sources statement in the footer of the design itself, so when the infographic is shared on other sites there is no mention of where the data came from.  Infographic designs really need to have the data sources listing in the image file so they go with the infographic when shared online.

Found on Infographic Journal

Monday
Oct012012

Honda Accord: 30 Years of U.S. Production

Honda Accord 30 Years of American Craftmanship infographic

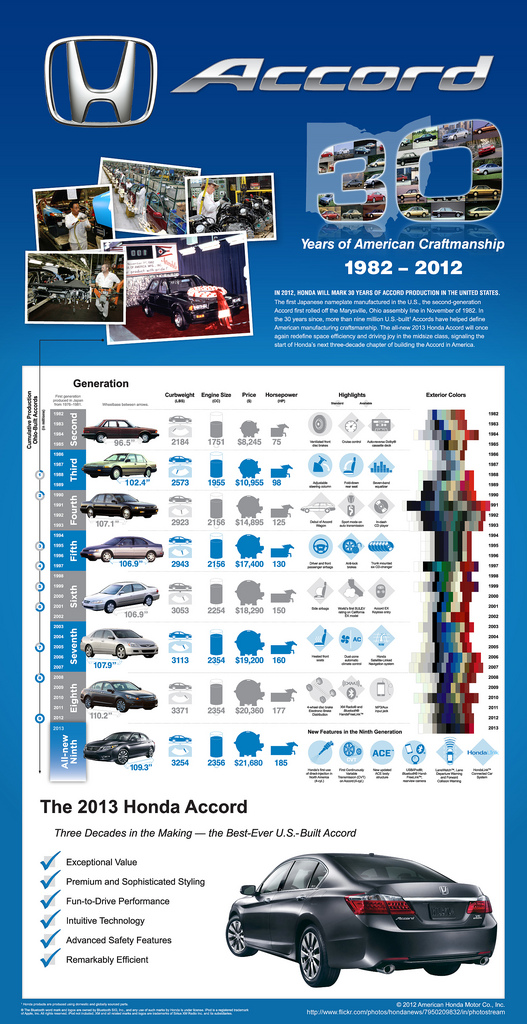
Honda Accord: 30 Years of American Craftmanship is a large infographic from Honda America that was released as part of the release of the new 2013 model design of the Honda Accord in August.  Designed by Jeremy Yingling with InfoNewt (my company) this is a very brand specific, marketing-style infographic.

IN 2012, HONDA WILL MARK 30 YEARS OF ACCORD PRODUCTION IN THE UNITED STATES.

The first Japanese nameplate manufactured in the U.S., the second-generation Accord first rolled off the Marysville, Ohio assembly line in November of 1982. In the 30 years since, more than nine million U.S.-built1 Accords have helped define American manufacturing craftsmanship. The all-new 2013 Honda Accord will once again redefine space efficiency and driving joy in the midsize class, signaling the start of Honda’s next three-decade chapter of building the Accord in America. 

The 2013 model becomes the ninth major design generation of the Accord.  This gave us the opportunity to highlight differences each major model design has brought to the Accord over the last 30 years.  The design visualizes the major technical specifications, the major advancements included in the Accord and shows the multi-year periods that each design generation was available.  The eye-catching color-waterfall shows the available exterior colors available for every model year, and the milestones along the left-side of the design show the progression to reach a cumulative total over 9 million Accords produced in 2012 coming out of the manufacturing plant in Marysville, OH.

Honda has done a great job of utilizing this one infographic design in a handful of different ways.  The infographic was initially used as 9’ banners at the Honda press events, and included in the press kits provided to everyone invited to attend.  Honda has now released the infographic online on the Honda News page on Flickr, making the design available to everyone.

Monday
Jul232012

True Colors: What Your Brand Colors Say About Your Business


True Colors: What Your Brand Colors Say About Your Business infographic

Does your companies brand reflect their business correctly? Check out True Colors: What Your Brand Colors Say About Your Business infographic from Marketo.

The most prominent brands in the world are defined by their colors. Think of McDonald’s golden arches, the name Jet Blue, and UPS’ slogan, “What can Brown do for you?” These companies, and many others, strategically use colors in their logo, website, and product to appeal to customers. As a B2B marketer, it’s important to think about how you utilize colors and what the colors you choose say about your business.

Research has found that different colors provoke very different reactions in people. Marketo choose to use the color Purple for branding because at the time Marketo was founded, purple was relatively un-used. Additionally, purple represents wealth, royalty, and richness which also has associations to leadership and revenue. Integrating your brand colors in your logo, landing pages, product, and more will help you achieve the highest impact. We put the rainbow under a microscope to find out how each color can help you connect with your consumers.

Designed by Column Five Media, this is a really good infographic.  The use of the specific colors in question make the design attractive and very easy to follow.  I also like the use of icons to show industries that use the different main colors.  The icons and bullet lists also help cut down on the amount of text the audience has to read.

A couple things I would change: 

  • There are a number of statistics at the top that should have been visualized instead of just making the fonts really big.
  • There are a number of what appear to be quotes from different sources about the power of colors, but the sources aren’t citied.  I assume they’re a part of the sources listed in the footer, but quotes should be immediately attributed.
  • Which Colors are Companies Using Most? adds up to 103%.  It’s not clear if these should be mutually exclusive or if the study counts multiple colors from the same company in the results.
  • The bottom should have a copyright and the URL link to the original infographic landing page. 

Thanks to Carra for sending in the link!

Friday
May252012

NASCAR 101: The Beginner’s Guide to NASCAR

NASCAR 101 The Beginner’s Guide to NASCAR infographic

Have you ever watched NASCAR? Apparently, its the 2nd most popular professional spectator sport in the U.S.! However, if you haven’t, the NASCAR 101: The Beginner’s Guide to NASCAR infographic from Quicken Loans Racing gives an illustrated breakdown of the 2012 Sprint Cup Series.

By now you’ve heard that Quicken Loans is dipping our toes in the whole NASCAR sponsorship world. We’re new to the whole thing, so we decided to put our creative heads together and make a super cool, fun-for-your-eyeballs NASCAR 101 infographic to explain the basics of NASCAR!

Maybe you’re new to racing and could use an introduction?  

Maybe you’re a superfan and you want to help your uninformed friends/family members/random people on the street realize the awesomeness of stock car racing?  

Maybe you like beautifully-designed artwork that is not only pleasing to the eyes but chock full of neat info?


Check it out.

This is a cool infographic design that does a fantastic job of communicating the basics.  Bold color scheme that uses the black background and textures to embody racing.  Simple, clear visualizations that are easy for the reader to understand.  Not too many stats or information crowded into the design to keep the overall design clean.

At the bottom, there should be a copyright statement and the URL to final the original landing page.  I linked back to the original landing page here, but not everyone will.

Found on TopSpeed.com


Friday
May112012

Backpacking Basics

How to choose and use a backpack infographic 

Everyone loves the great outdoors! Well… until something doesn’t go as planned… With the informative How to Choose & Use a Backpack infographic from REI, enjoying roughing it without having to, you know, rough it.

Need a break from the daily multitasking merry-go-round? Trade in your digital devices for boots and backpacks—they’re your ticket to off-the-grid adventures and the wonders of the backcountry! With the right pack and a little preparation, you can head out for a day hike or a through-hike and say “CUL8R” to the daily grind. 

Many consumer products have an educational piece to them, and the challenge for a retailer is to educate their customers without feeling like a hard-sell ad.  This infographic does a great job of educating and informing their audience without listing available products, brands or any pricing.  It’s just purely informative, and adds to REI’s brand credibility.

The design is a little text-heavy for my taste, but it’s packed with information.  Some of the data in the text of the design could also have been visualized to make it easier for the reader to comprehend.  Weight ranges, lengths and the number of items that fit in the backpack would have been great visuals.

I don’t mind the URL link to the REI Backpack products page, but there should also be the URL to the original infographic landing page.  When people share this online with their firends as an informative piece, they will want to share the infographic URL.  There should also be a copyright statement at the bottom.

Thanks to Ron for sending in the link!