About
Randy Krum
President of InfoNewt.
Data Visualization and Infographic Design

Infographic Design

Infographics Design | Presentations
Consulting | Data Visualizations

DFW DataViz Meetup

Join the DFW Data Visualization and Infographics Meetup Group if you're in the Dallas/Fort Worth area!

Search the Cool Infographics site

Custom Search

Subscriptions:


Feedburner

The Cool Infographics® Gallery:

How to add the
Cool Infographics button to your:

Cool Infographics iOS icon

- iPhone
- iPad
- iPod Touch


Read on Flipboard for iPad and iPhone

Featured in the Tech & Science category

Flipboard icon

Twitter Feed
From the Bookstore

Caffeine Poster

The Caffeine Poster infographic

Entries in racing (2)

Tuesday
Jul312012

Evolution of the F1 Car: Video & Infographic

This is totally cool!  Here is an infographic animation created by Rufus Blacklock of his infographic Evolution of the F1 Car. You can find his original video on biplaneblues.blogspot.com.

All done :) here you can watch 60 years of F1 design condensed into a minute. Each car is the winning chassis from the respective seasons. The music is ‘Together’ by She.


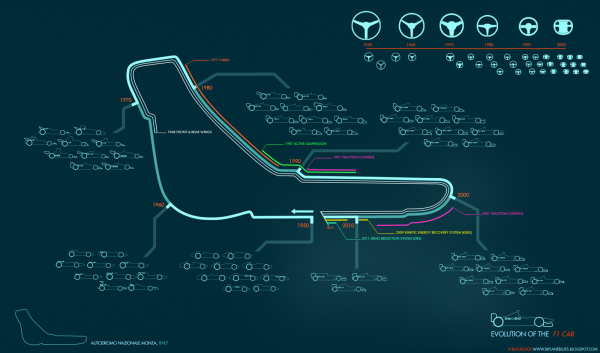
Evolution of the F1 Car infographic 

Here is the original Evolution of the F1 Car infographic that the video was based off of. Found at biplaneblues.blogspot.com.

Woo finished! This map tracks the history of F1 cars across the circuit at Monza. Hopefully its clear enough… its my first infographic, let me know if you have any keen ideas to improve readability.

The cars are grouped into decades, around the track you can follow various innovations and driver aids, some which became banned. Top right is steering wheel development.


Friday
May252012

NASCAR 101: The Beginner’s Guide to NASCAR

NASCAR 101 The Beginner’s Guide to NASCAR infographic

Have you ever watched NASCAR? Apparently, its the 2nd most popular professional spectator sport in the U.S.! However, if you haven’t, the NASCAR 101: The Beginner’s Guide to NASCAR infographic from Quicken Loans Racing gives an illustrated breakdown of the 2012 Sprint Cup Series.

By now you’ve heard that Quicken Loans is dipping our toes in the whole NASCAR sponsorship world. We’re new to the whole thing, so we decided to put our creative heads together and make a super cool, fun-for-your-eyeballs NASCAR 101 infographic to explain the basics of NASCAR!

Maybe you’re new to racing and could use an introduction?  

Maybe you’re a superfan and you want to help your uninformed friends/family members/random people on the street realize the awesomeness of stock car racing?  

Maybe you like beautifully-designed artwork that is not only pleasing to the eyes but chock full of neat info?


Check it out.

This is a cool infographic design that does a fantastic job of communicating the basics.  Bold color scheme that uses the black background and textures to embody racing.  Simple, clear visualizations that are easy for the reader to understand.  Not too many stats or information crowded into the design to keep the overall design clean.

At the bottom, there should be a copyright statement and the URL to final the original landing page.  I linked back to the original landing page here, but not everyone will.

Found on TopSpeed.com