About
Randy Krum
President of InfoNewt.
Data Visualization and Infographic Design

Infographic Design

Infographics Design | Presentations
Consulting | Data Visualizations

DFW DataViz Meetup

Join the DFW Data Visualization and Infographics Meetup Group if you're in the Dallas/Fort Worth area!

Search the Cool Infographics site

Custom Search

Subscriptions:


Feedburner

The Cool Infographics® Gallery:

How to add the
Cool Infographics button to your:

Cool Infographics iOS icon

- iPhone
- iPad
- iPod Touch


Read on Flipboard for iPad and iPhone

Featured in the Tech & Science category

Flipboard icon

Twitter Feed
From the Bookstore

Caffeine Poster

The Caffeine Poster infographic

Entries in executive (19)

Monday
Feb082016

2016 State of Small Business Report

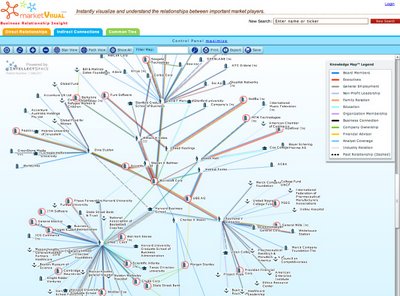
The 2016 State of Small Business Report from Wasp Barcode highlights some of the most pressing issues facing small business owners.

According to the 2016 State of Small Business Report, 71 percent of them expect to increase revenue in 2016, a 14 percent increase over 2015’s revenue optimism.

Their optimism is holding up in the face of a few big hurdles this year, namely hiring new employees, increasing profit, and employee healthcare. More than 1,100 small business owners and executives identified these items as their top three challenges for 2016.

In addition to identifying business challenges, the State of Small Business Report also investigated small businesses’ views on the economy, hiring, government, marketing practices, and use of information technology.

Check out a few highlights and let us know what you think.

I really like the use of the infographic to highlight a few key points to draw in readers to the full report. 

A few things I would suggest that designers and publishers can learn from:

  • Make the fonts larger or make a larger version of the infographic image file available. Much of the text in the "full size" version is still too small to read.
  • Use a good description in the infographic image filename. This image was just called "Infographic-FULL-SIZE.png" which hurts you visibility with the search engines.
  • Visualize all of the data. When some data in an infographic is listed as text-only, it is perceived by readers as less important and often skipped over.
  • Include a copyright or Creative Commons license statement. I can't tell if there is one, it's too small for me to read.
  • Include the URL to the infographic landing page so readers can find the full-size original infographic when it appears on other sites that don't link back appropriately. I appreciate the link to the full report they are promoting, but readers also need the link to the infographic landing page.
  • The infographic should be linked or included in the full report page. 

Thanks to Anna for sending the link!

Monday
Nov092009

ANC Spending infographic


Diaan Minhardt created this simple infographic for his blog, Dreamfoundry, to show how money being spend on new cars for government officials could have been spent differently to build houses.
I’ve been keeping an eye on the rivers of money haemorrhaging out of the government coffers for idiotic reasons for some time now. What I saw inspired me to create this very simple infographic.
Thanks Diaan!

Wednesday
Oct072009

CEO Compensation Infographic Contest Winner!


In September, GOOD magazine held an infographic contest to illustrate the top CEO compensation packages.  The above infographic by Dee Adams wins the prize!
Dee Adams’s piece “The Top 8 of CEO Compensation” does an excellent job of illustrating the massive salaries of CEOs and relating them to regular employees in a clean and simple manner. It’s our winner, and Adams will take home our prize package, including a GOOD T-shirt, a free subscription, and $250. You’ll be able to see her infographic in print in our next issue as well.
All of the entries are available for viewing here, but I wanted to include a few of my other favorites:


By Robin Richards:


By Jessica Karle:


Monday
Sep142009

Obama's Worldwide Stamps of Approval infographic


From our friends at GOOD transparency, is a simple infographic showing President Obama's worldwide approval rating.  I like the use of stamps to help identify the countries around the world, and that the order is representative of highest approval to lowest approval ratings.  I think this graphic lacks the use of illustration to convey the data.  The actual approval ratings are only communicated with the numbers without any graphic representation.
During the campaign, President Obama argued that his election would help restore the image the rest of the world has of United States.  In the six months since his election, his approval ratings at home have slipped, though they remain high. Around the rest of the world, opinion is mixed. A recent study by WorldPublicOpinion.org asked people in 21 countries whether they had confidence that Obama would “do the right thing” when it came to world affairs. Our latest Transparency is a look at their responses.
One other criticism would be that the text implies that we should be looking at how worldwide opinion has changed since Obama's election, but the data is actually only a snapshot of opinions six months after the election.  No indication is this is higher or lower than the opinions at the time of his election.

A collaboration between GOOD and Michael Newhouse at Newhouse Design.

Thanks Michelle for the link!

Tuesday
Aug042009

NEW Death and Taxes 2010 poster!!

First, Jess from WallStats.com has released the 2010 Death & Taxes poster.  This is one of the best infographic examples today.  It's extremely informative, and the topic has a very wide reach.  The Death & Taxes poster from 2007 was my initial post on Cool Infographics, so I'm very excited to see this update.   Now the 2010 version is available to purchase as a poster here. Great job Jess!

Second, I'm really impressed by the viewer code for the poster. It's from Zoomorama.com, and lets me embed the interactive viewer.  The built-in zoom is pretty nice, but the Quick Find index on the left side is the best part.

Friday
Jun262009

Imagine Leadership, great infographic video


Great work from our friends at XPLANE.com for the Harvard Business School! Thanks to both XPLAE and Harvard for making this video available to the public.

The inspiring and thought-provoking piece on global leadership was created in collaboration with Nitin Nohria, Richard P. Chapman Professor of Business Administration, and Co-Chair of the Leadership Initiative at Harvard Business School.

The video debuted earlier this month at Harvard Business School's "How Can Leadership Be Taught" symposium on June 9 and 10. We were honored to partner with Nitin to create a visually appealing, provocative piece that would inspire viewers to take action, get involved and be motivated to lead.

"Imagine Leadership" is six minutes long and available for viewing on YouTube http://www.youtube.com/watch?v=TuuTlQ0FzEU. Inspired by the popular "Did You Know? 2.0" video that we created, the new piece has similar qualities in how it visually represents key factoids, people and critical information. However, unlike "Did You Know," this piece combines illustration with graphics and photography, allowing the most appropriate visual content to represent each subject.

Monday
Jun222009

Market Visual (BETA) knowledge maps


I came across Market Visual Knowledge Maps this morning.  It claims to still be in BETA, and it maps business relationships based on companies or people that you enter.  It seems to build these mind maps on the fly, and saves any maps that you have build so you can retrieve them later.


It's a service you have to pay for, but if you're looking through annual reports and SEC filings to find people and connections, this will save you a bunch of time.  There's a fully interactive sample map, as well as an introductory video.

Wednesday
Feb252009

Taking Apart the $819B Stimulus Package

Very detailed infographic from the Washington Post showing how the proposed stimulus package is broken out between ares of spending and tax cuts.

The centerpiece of President Obama's domestic agenda is an $819 billion economic stimulus plan. The Senate will consider the measure this week, with an eye toward the amount of tax cuts and spending. Republicans and Democrats spar over what to consider a tax cut. An analysis by the nonpartisan Congressional Budget Office tallies the tax-cut portion to be significantly less than the one-third Democrats claim it to be.

SOURCE: Congressional Budget Office | Reporting by Karen Yourish, graphic by Laura Stanton - The Washington Post - February 01, 2009

Saturday
Nov292008

How Star Wars Changed the World


The original Star Wars has certainly gone on to produce more than just sequels.  It has created the people and the technologies that are now considered the best in the industry.  Michelle Devereaux created this family tree for Wired magazine back in 2005 and I love how the line colors indicate people, technologies and company connections, but the tree is organized into movies, sound, effects and technologies.

I actually believe the tree is incomplete.  I think Star Wars had far greater reach and influence that what Michelle mapped out here.

It all started with a band of rebels who wanted to help a farmboy follow his dream.  Three decades later, the Star Wars empire has grown into one of the most fertile incubators of talent in the worlds of movies (Lucasfilm), visual effects (Industrial Light & Magic), sound (Skywalker Sound), and videogames (LucasArts).  Along the way, some of the original Lucas crew has gone on to become his biggest competitors.  This chart maps the people, companies and technologies touched by the Force. - Michelle Devereaux
Thanks Alwyn!

Tuesday
Nov042008

Create Your Own Electoral Map


Since today is Election Day, the nytimes.com has a neat feature that lets you create your own Electoral Map.  Ireally like that it also gives you the option (seen above) to view the country with teh states sized by electoral votes or by geography (below).


It's been preloaded with the NYTimes.com breakdown of how the states may fall today, and which states are still undecided.  It's a little misleading because there are more undecided states, but they have assumed they will lean as the have historically.  It also allows you to change them on your own so you can see the effect on the overall election.

When your done playing, you can also see the NYTimes version of the map that includes the states that are leaning, but are not yet truly decided.


As you can see, the NYTimes.com site is predicting a Democratic win.  Let's see what really happens today.