About
Randy Krum
President of InfoNewt.
Data Visualization and Infographic Design

Infographic Design

Infographics Design | Presentations
Consulting | Data Visualizations

DFW DataViz Meetup

Join the DFW Data Visualization and Infographics Meetup Group if you're in the Dallas/Fort Worth area!

Search the Cool Infographics site

Custom Search

Subscriptions:


Feedburner

The Cool Infographics® Gallery:

How to add the
Cool Infographics button to your:

Cool Infographics iOS icon

- iPhone
- iPad
- iPod Touch


Read on Flipboard for iPad and iPhone

Featured in the Tech & Science category

Flipboard icon

Twitter Feed
From the Bookstore

Caffeine Poster

The Caffeine Poster infographic

Entries in compensation (7)

Wednesday
Oct072009

CEO Compensation Infographic Contest Winner!


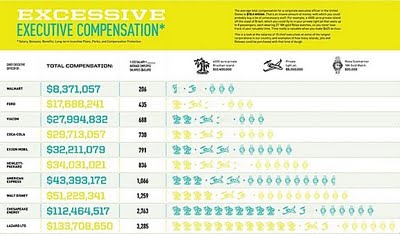
In September, GOOD magazine held an infographic contest to illustrate the top CEO compensation packages.  The above infographic by Dee Adams wins the prize!
Dee Adams’s piece “The Top 8 of CEO Compensation” does an excellent job of illustrating the massive salaries of CEOs and relating them to regular employees in a clean and simple manner. It’s our winner, and Adams will take home our prize package, including a GOOD T-shirt, a free subscription, and $250. You’ll be able to see her infographic in print in our next issue as well.
All of the entries are available for viewing here, but I wanted to include a few of my other favorites:


By Robin Richards:


By Jessica Karle:


Tuesday
Jul212009

The American Dream/Nightmare


I really like this one from gimmiethescoop.com.  It’s pretty simple (it’s a 3D column chart), but it get’s it’s point across well.  The accumulated debt for the average American continues to outpace their annual income.  The concept of living beneath your means is foreign to a lot of people.


Found a link on nerdmodo.com

Monday
May052008

Where Does the Money Go?


From the nytimes.com, this graphic visually represents how average consumer spending breaks down, and the color code shows how much spending in that category has changed in the last year. For example, Gasoline is 5.2% of an average consumer's spending, and it has risen 26% from 2007 to 2008.

As far as I can tell, this is actually a treemap, but in a new shape. More details pop-up when you mouse over each of the individual shapes.

Thanks to Tony, for sending in the link.

Friday
Feb222008

National Gruntledness Index


New interactive map on CareerBuilder.com charts the results of user survey data on how gruntled (or disgruntled) people are with their jobs across the country. You can even narrow the map results to a particular industry.

The map doesn't change that often, but when you roll your mouse over the map, it highlights the cities where the score has changed.

Thanks Kevin for the email.

Friday
Oct122007

Radial Organization Chart

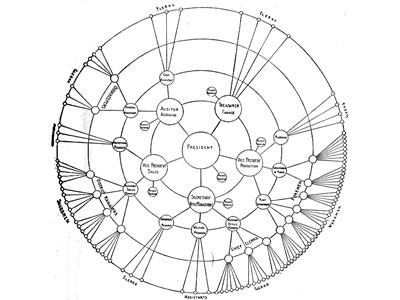
Found on Visual Complexity, this chart from 1924 is an interesting variation of an organization chart. With the authoritarian leader in the center, the subordinates are mapped outward from the center. Rings at different radii show peer level responsibility.

Sunday
Sep092007

The Wealthiest Americans Ever


From the NYTimes in July 2007, an interactive infographic ranking the Wealthiest Americans after you convert their fortunes to today's dollars using the relative share of G.D.P.

Scrolling your pointer over the photos or the fortune amount shows more detail of the individual. Lots of black & white portraits! Only current rich folk Bill Gates and Warren Buffet made the list with color portraits.

Saturday
Aug042007

Executive Salary Comparison


Portfolio.com has a number of good interactive infographics on their News & Markets/Multimedia page.

This Salary Comparison is simple but hugely informative showing the difference in number and visual representation of size, but also over time as you move the slider on the left. In 2005 the difference between the average worker and the CEO is so large it doesn't fit on the screen anymore. But that is down from 2000 when the difference was the largest at 548x.