9 Great DataViz & Infographics Tools with Education Discounts
Data visualization and data literacy are necessary life skills, and you should start developing them now! Whether you need to make a diagram for a Science project, a presentation for your History class, or a chart to solve that Math problem, you should start learning how to use data visualization tools while you’re in school. These tools are being used in classrooms from elementary school up through colleges and universities. While many online design tools offer free trials, these tools offer exclusive educational prices for students, teachers and educators to give them the means to more easily visualize information at a great price.
Here I share some of today’s most popular online data visualization and infographic tools, all offering educational prices. Because these are all online tools, they are all cross-platform, making them great for any computer a student may have; Windows, Mac or Linux. Follow the links to find the current education pricing deals!
I love that all of these online tools are helping to improve data literacy for students and educators all over the world! Which are you favorites? Any more online tools with education pricing plans for students and teachers that I missed?
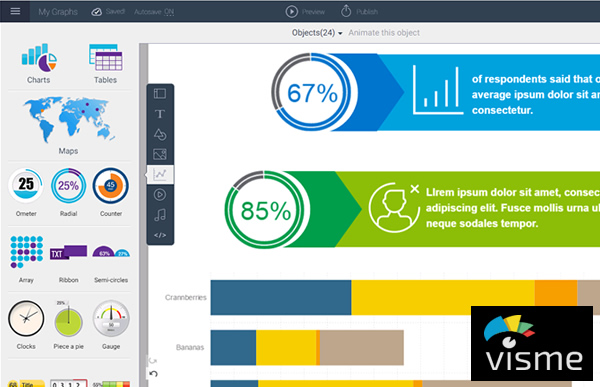
Visme
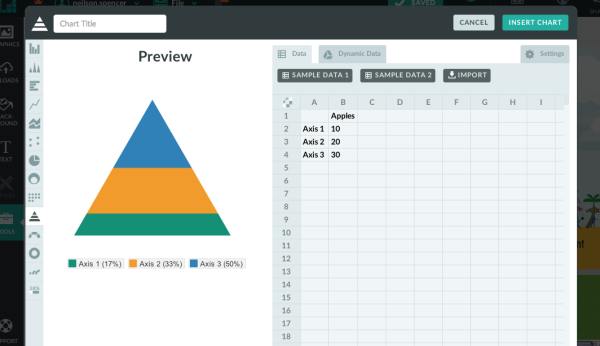
Visme is an online tool used to visually present your ideas in the form of infographics, presentations, reports, and much more. Visme has a built-in charting tool gives you the power to easily transform your data into visual content and with their easy-to-use editor. Hundreds of fonts, millions of free images, and thousands of quality icons for use in your designs. Share your designs online with a direct link, post on social media, embed on a website, or download for offline use.
Contact for educational pricing: http://support.visme.co/
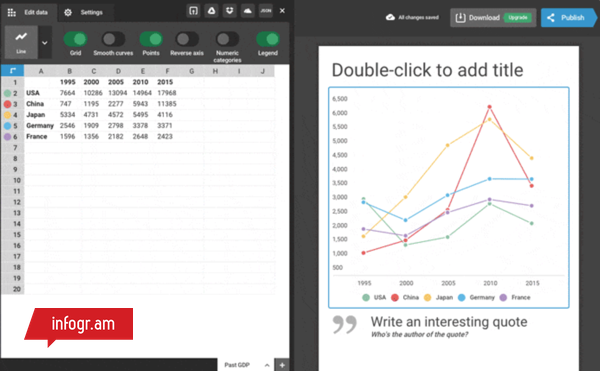
Infogr.am
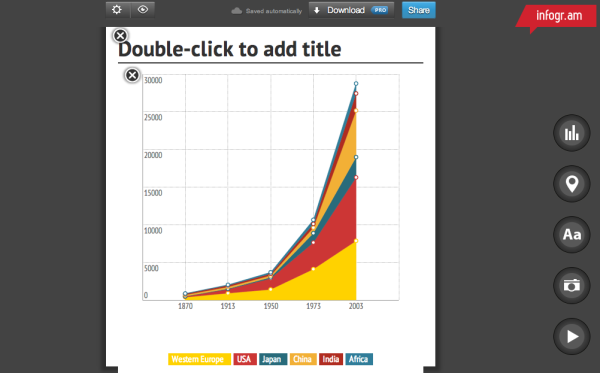
With Infogr.am, you have the power to make your data look its best. Users can easily create interactive charts and graphics that require zero coding. And to make sure your data is always up-to-date, you have the option to connect your chart to live sources like Google Sheets a Dropbox file, or a JSON feed. Educators can create a team account for an entire class.
Contact for educational pricing: https://infogr.am/education
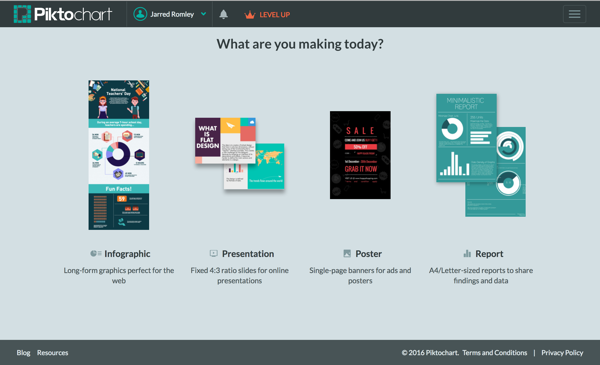
Piktochart
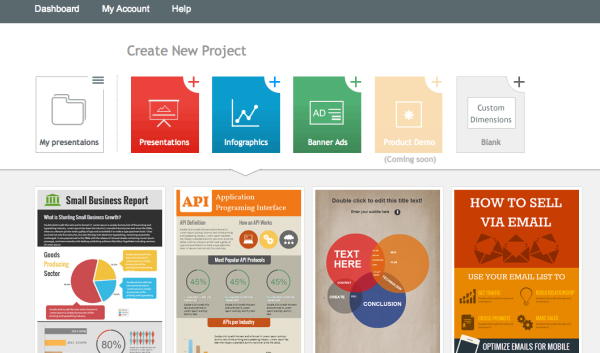
Take your visual communication to the next level with Piktochart, an easy-to-use infographic maker. Create your charts by importing your data from a Microsoft Excel file or a Google spreadsheet. With a library of hundreds of professionally-designed templates, creating infographics, reports, posters, and presentations has never been easier. Educational pricing for individuals or whole classrooms.
Individual and classroom prices: https://piktochart.com/pricing/education/
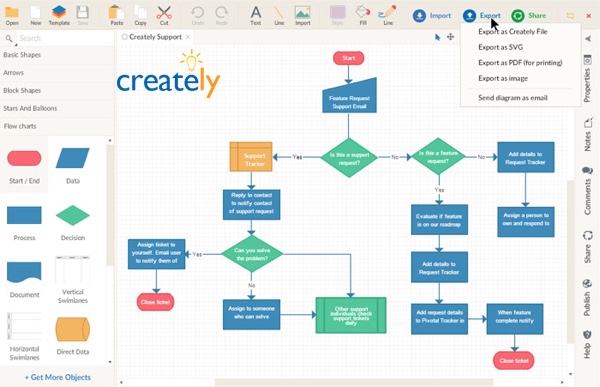
Creately
With Creately, you can easily make beautiful diagrams in no time. Flow charts, mind maps, organization charts, Venn diagrams, Gantt charts, network diagrams and more. Thousands of ready-made subject-specific templates and over 40 types of diagrams with specialized shape sets are available to make sure your diagram looks its best. And real-time online collaboration allows you to work with fellow students.
Contact for educational pricing: http://creately.com/diagram-products#education
Venngage
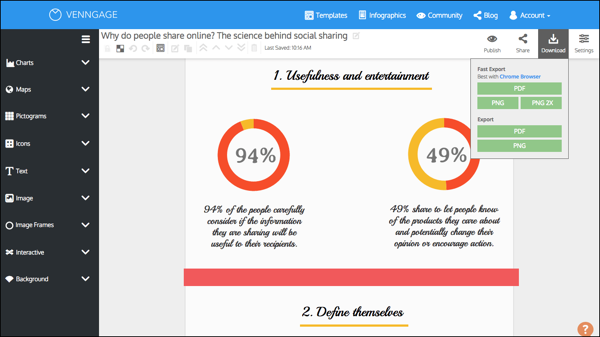
Venngage allows users to create infographics in just three easy steps: choose a template, add charts and visuals, and customize your design. In just minutes you can create a visual story in the form of posters, social media posts, and infographics. Post your final designs on social media, embed on websites, or download as an image or PDF file.
Register for a classroom Education account, includes 35 users: https://venngage.com/education-pricing/
Prezi
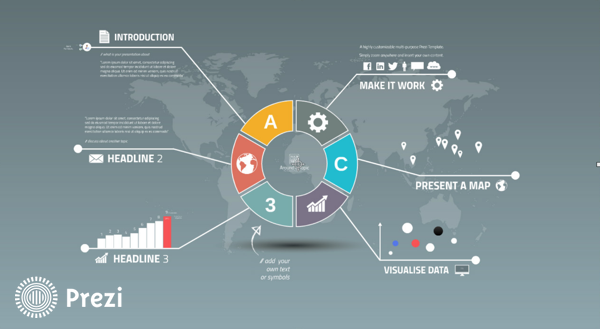
Prezi is the tool for creating engaging and memorable presentations with the charting tool, editable images, and embedded videos. Give your presentations online or offline, using the library of templates as your starting point. Prezi presentations are built on an open canvas and spatial movement transitions that are unique and easy-to-use.
Choose an educational pricing package: https://prezi.com/pricing/edu/
Lucidchart
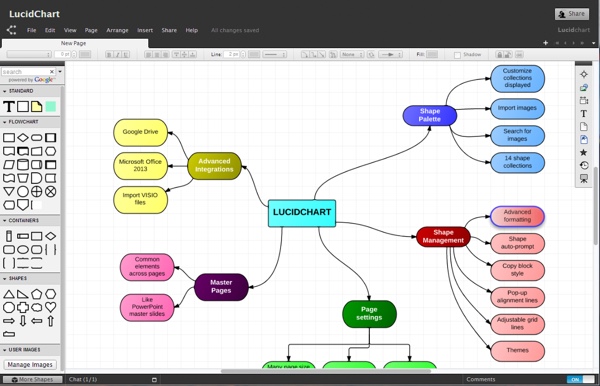
Lucidchart is an online diagramming tool for everyone. You can create flow charts, Venn diagrams, mobile app mockups, network diagrams and more using the extensive shape libraries, or perform a Google image search right in the editor. You can even add a YouTube video to your diagram!
FREE accounts for students and teachers: https://www.lucidchart.com/pages/usecase/education
Easel.ly
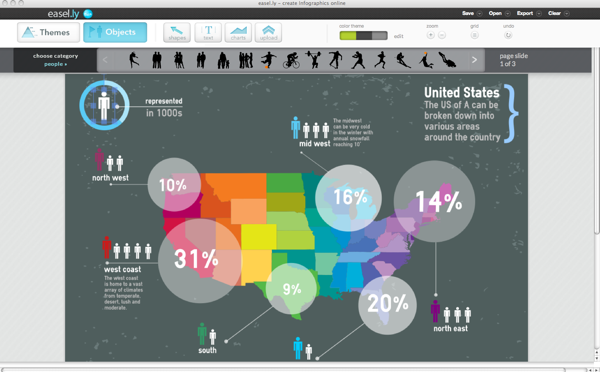
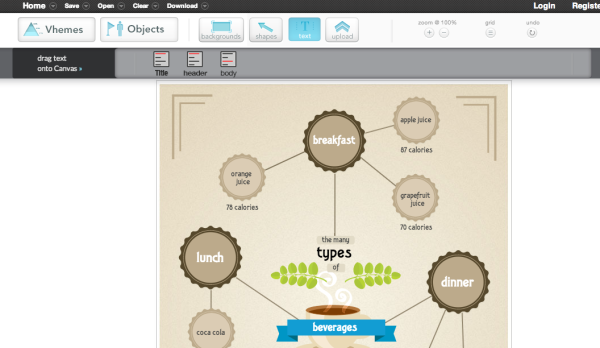
With over thousands of infographic templates to chose from, Easel.ly makes creating and sharing your visual ideas easy. The drag-and-drop interface helped Easel.ly win the Best Websites for Teaching and Learning Award from the American Association of School Librarians (AASL) in 2013. Create your infographic, and then publish online or download a high-resolution file for offline use. Check out their free ebook: How to Use Easel.ly in your Classroom (https://www.easel.ly/blog/infographicsforeducation)
Contact for educational pricing: https://www.easel.ly/contactus
Plot.ly
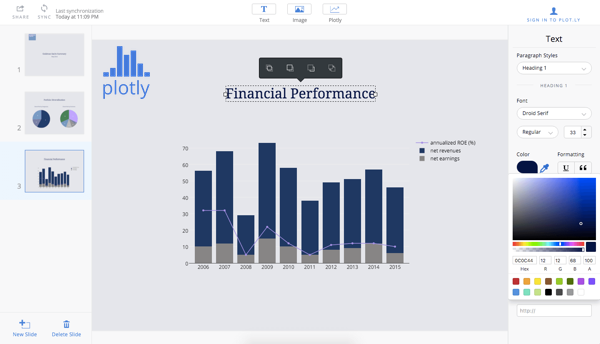
Plot.ly is a higher-level, advanced data visualization platform that helps data science, engineering, and analytics students create create informative graphics using an open source visualization library and an online chart creation tool. With Plotly, users can easily import data, create charts, and share their findings by embedding them on a website, exporting them, or creating presentations and dashboards. Create technical visuals using tools and APIs for D3.js, Python, R, MATLAB, Excel and more.
Student pricing for Professional features: http://marketing.plot.ly/education.html
Article was reposted by The Huffington Post


 Randy
Randy