About
Randy Krum
President of InfoNewt.
Data Visualization and Infographic Design

Infographic Design

Infographics Design | Presentations
Consulting | Data Visualizations

DFW DataViz Meetup

Join the DFW Data Visualization and Infographics Meetup Group if you're in the Dallas/Fort Worth area!

Search the Cool Infographics site

Custom Search

Subscriptions:


Feedburner

The Cool Infographics® Gallery:

How to add the
Cool Infographics button to your:

Cool Infographics iOS icon

- iPhone
- iPad
- iPod Touch


Read on Flipboard for iPad and iPhone

Featured in the Tech & Science category

Flipboard icon

Twitter Feed
From the Bookstore

Caffeine Poster

The Caffeine Poster infographic

Entries in electronics (5)

Wednesday
May112016

The Growth of the Internet of Things

Growth in the Internet of Things Infographic

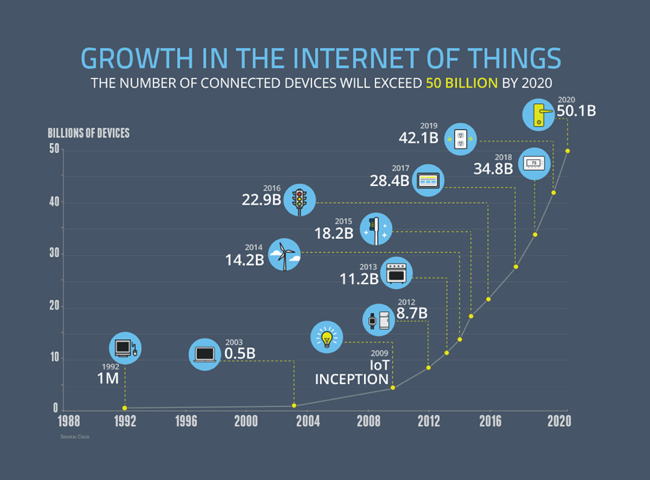
The current projection data from Cisco is that the IoT (Internet of Things) will reach 50 Billion devices by the year 2020! Visualized by the NCTA (National Cable & Telecommunications Association) as the Growth in the Internet of Things.

Today’s Internet is driven by wired and wireless networks, keeping us connected throughout our daily lives. With the advent of new digital devices that constantly link us to the Internet, these networks have become much more than just a simple vehicle for information and communications. They now enable us to track our daily habits, monitor our health, manage home energy use and track nearly any other data we can imagine. These devices make up what we call the Internet of Things – a web of connected objects that are linked via networks that can interact with each other and with us.

The Internet isn’t merely developing, it’s exploding, and the numbers prove it. Take a look at our graphic below — it shows the advancing surge of connected devices using the Internet.

Today, there are more connected devices than there are human beings on the planet. This expansion isn’t just from cell phones, tablets and computers – it’s thanks to toothbrushes, stovetops and millions of other devices that now have IP addresses. Estimates show that there will be over 50 billion connected devices by 2020.

Fast, ubiquitous Wi-Fi and increasing home broadband speeds will drive the Internet of Things and the ever-expanding web.

A clean and simple line chart tells this story very well. Notice that the chart was designed with many of the principles for storytelling in data visualization we discuss every day.

  • No chart legend. The data is shown directly in the chart
  • Minimal gridlines to simplify reading the chart and clean up the visual noise gridlines create
  • No separate data table. The relevant numbers are shown directly in the chart
  • Minimal axis labels (you don't need to show every year)
  • Use of visual icons to help communicate each milestone. 

Suggestion: I would move the icons and data much closer to the actual data points on the chart. There are too many connecting lines.

Thanks to Heather for sharing on Linkedin!

Monday
Jan192015

The Future of Rare Earth Elements

Rare Earth Elements infographic

Rare Earth Elements make up a large portion of our high tech equipment and the demand for the elements is only increasing. This infographic, published by Buy Metal Online, has that examines the situation and the troubling shortages in our future.

Here we have an infographic that takes a look at rare earth elements (REE) including information about what they are, what we use them for, who’s producing the World’s REEs and more.

Good topic with clear visualizations and attractive illustrations.  They have a lot of valuable information packed into this design. However, in my opinion, there’s way too much text included, with multiple paragraphs explaining each section. In my experience, if readers see this much text in an infographic, they are likely to perceive it as too complicated and detailed. They’ll probably move on without ever reading it. Infographics are supposed to be simple explanations that are quick and easy to understand.

Thanks to Dave for sending in the link!

Monday
Jan072013

Can You Protect Yourself from Hackers at CES?

Can You Protect Yourself from Hackers at CES? infographic

Are you headed to CES in Las Vegas this week?  Do you know how to protect your electronic devices?  The Is Your Device Safe at CES? infographic from Novell shows us some heartbreaking stats.

The Numbers Don’t Lie

You don’t think it will ever happen to you, do you? Well, think again. With a laptop or tablet being stolen every 53 seconds you can literally lose your mobile device at any minute. Oh, and by the way, you’re losing a lot more than that precious device: sensitive company documents, passwords, credit card information, etc. So what are you doing to protect that phone/iPad/laptop? Apparently very little as only 4% of smartphones have Mobile Device Management security installed on them. Take a look at a few of the scary numbers and some ideas you could implement to protect your device and your precious content.

This design is long, but there’s a lot of information to share.  I like the simple color scheme, and there’s some really good data included in here.  However, most of the statistics are shown in text only, which is disappointing.

I’ve said it many times here on Cool Infographics.  Big fonts are not data visualizations.  You want your readers to comprehend and remember the numbers you are showing them in your infographic design.  To be successful at that you need to put the numbers into context for the reader, by visually comparing them to another value or showing them the scale of the value.

Thanks to Mat for sending in the link!


Wednesday
Oct172012

Fast Fourier Transforms: An Infographic Study Guide

Fast Fourier Transforms: An Infographic Study Guide

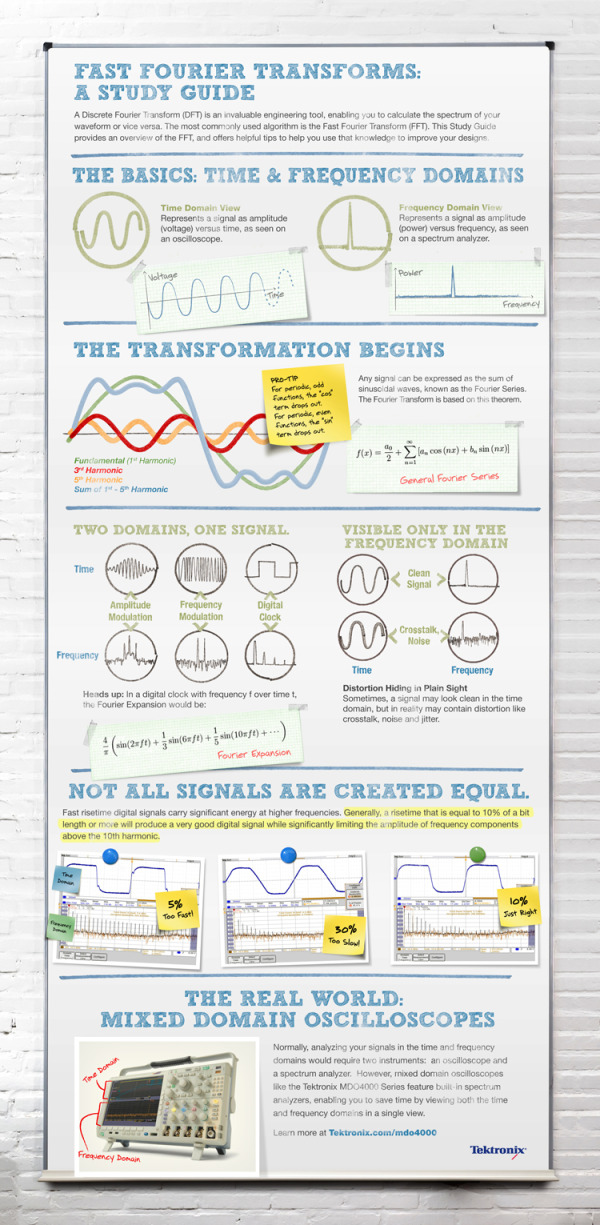
Fast Fourier Transforms: A Study Guide from Tektronix is a great example of using data visualization and infographic design principles to visually explain the math behind their oscilloscopes.

Most engineers don’t remember the complex algorithms and concepts of the Fast Fourier Transform (FFT) and Discrete Fourier Transform (DFT) that they learned in college. Instead of dusting off your textbooks, check out this Fast Fourier Transform visual from Tektronix. It boils down the key tips and practical knowledge for Engineers and their designs. With this visual, we hope you can skip digging up your old text books and get back to your designs.

The design does a good job of telling a story top-to-bottom.  Starting with the basics, moving into the more complicated math and finally applying the math to how the oscilloscope product works.

Definitely a design focused on their target audience, and not the general public.  However, using infographic design to simplify your message to customers is one of the most effective ways to clearly communicate your marketing message.  It’s more memorable to your audience when they come to a purchase decision, and communicating clearly builds your brand credibility with the subject.

At the bottom of the design, they should have included some type of license (copyright or Creative Commons) and the URL to the original infographic landing page.  Nothing wrong with listing the URL to the product page, but help readers interested in the information from the infographic find the original full-size version easily.

Thanks to Matt for sending in the link!

Monday
Jan092012

Everything You Need To Know About CES


The Consumer Electronics Show (CES) is this week in Las Vegas, NV (Jan 10-13).  Sortable.com has released this cool infographic, “Everything You Need To Know About CES” showing the history of the events, and some of the stats behind putting the show on every year.

The International Consumer Electronics Show is the biggest tech event of the year, with an expected 140,000+ visitors and 2,700 exhibitors who are planning more than 20,000 product announcements over a 4 day period. Sortable.com wanted to take a look at the history of CES and just how big the show really is.

I really love how the timeline shows the reader images of the actual products that were the key product launches at various times throughout the show’s history. 

A few things that make good infographic designs were left out.

  • The copyright.  Is this free to the public to reproduce, edit, publish and use for commercial purposes?
  • The URL of the infographic’s main landing page.  This always makes it easier for readers to find the original.
  • List the data sources, where did the stats come from?  Why should I believe your data?
  • The staggered timeline is disconcerting to readers.  The years should be evenly spaced out along the timeline.
  • Give the Designer credit

Thanks to Brenden for sending in the link!