About
Randy Krum
President of InfoNewt.
Data Visualization and Infographic Design

Infographic Design

Infographics Design | Presentations
Consulting | Data Visualizations

DFW DataViz Meetup

Join the DFW Data Visualization and Infographics Meetup Group if you're in the Dallas/Fort Worth area!

Search the Cool Infographics site

Custom Search

Subscriptions:


Feedburner

The Cool Infographics® Gallery:

How to add the
Cool Infographics button to your:

Cool Infographics iOS icon

- iPhone
- iPad
- iPod Touch


Read on Flipboard for iPad and iPhone

Featured in the Tech & Science category

Flipboard icon

Twitter Feed
From the Bookstore

Caffeine Poster

The Caffeine Poster infographic

Entries in clothes (11)

Friday
May262017

The Colors of Mister Rogers' Cardigans

Every Color Of Cardigan Mister Rogers Wore infographic

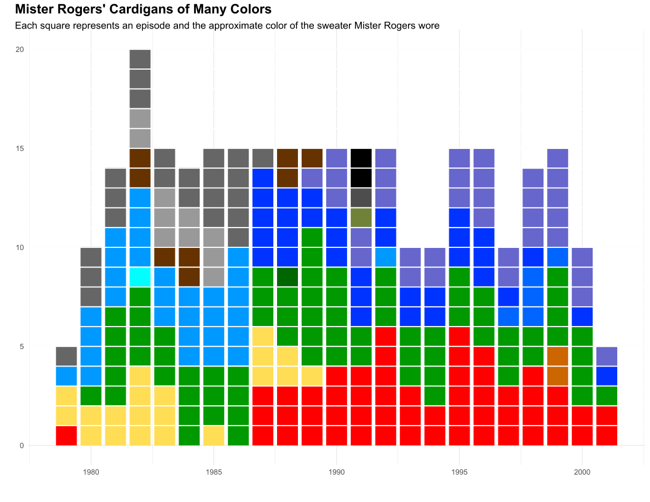
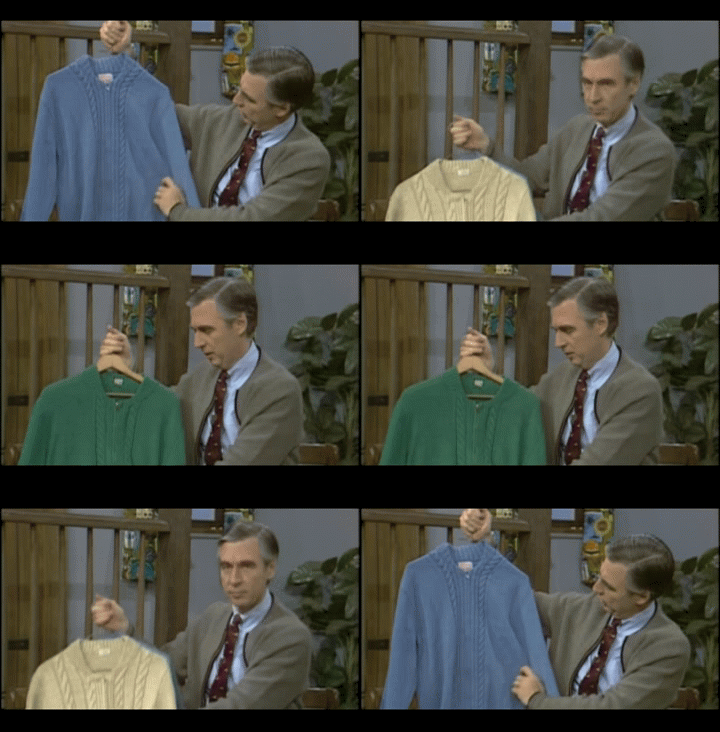
Owen Phillips was recently transfixed watching a Mister Rogers' Neighborhood marathon, and after finding the data, visualized Every Color Of Cardigan Mister Rogers Wore From 1979–2001 for The Awl.
From Owen:

For the past few days I’ve been transfixed by the “Mister Rogers’ Neighborhood” marathon that began on Monday afternoon over on Twitch. Like watching the “Joy of Painting” with Bob Ross, zoning out to “Mister Rogers” is an exercise in escapism. After Rogers helped reset my brain I began to wonder about all the handsome, colorful sweaters he famously wore. Did Rogers have a favorite?

Fortunately, Tim Lybarger, a 40 year-old high school counselor from just outside of Champaign-Urbana, Illinois, wondered the same thing a few years ago. Back in 2011, on his blog devoted to all things Mister Rogers, neighborhoodarchive.com, Lybarger recorded the color of every sweater Rogers wore in each episode between 1979 and 2001. “When I realized such a resource didn’t exist,” Lybarger told me over email, “I just felt like somebody needed to do it…might as well be me.”

The chart above uses the data Lybarger meticulously collected to show how Rogers’ preferences for the color of his cardigan changed over time.

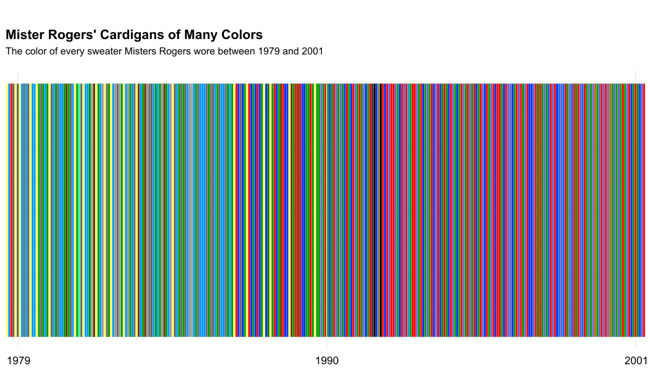
Every Color Of Cardigan Mister Rogers Wore Linear

When Owen organized them in a linear order, he found that color trends definitely appears. Later years had many more darker colors.

Found on FlowingData

Thursday
Nov172016

Men's Hats - The Complete Guide

Men's Hats - The Complete Guide infographic

Can't find a hat that looks good on you or don't even know where to start? Samuel Windsor created the Men's Hats - The Complete Guide infographic to clear the confusion on the matter. Feel confident enough to talk the talk at a hat shop, as well as pick the right style for your face shape.

Hats give a man distinction, confidence and protection. This diagrammatic guide will help you find the perfect hat to top your appearance. Confused about what crown to request? Will a flat cap suit a square face? Do you know your bowlers from your boaters?

Nice clean design that does a great job of "show, don't tell". You understand the differences much faster with a visual design like this.

This is also a good design example of a Long Online Lifespan. Hat shapes, styles and face shapes don't change every year. This infographic will be popular and relevant for years to come.

Two things missing from the footer of the design:

  • URL to the origial landing page and website. How can readers find your website?
  • A copyright or Creative Commons license

Thanks to Matt for sending in the link!

Wednesday
Feb032016

Men's Dress Codes Made Simple

Men's Dress Codes Made Simple infographic

Men's Dress Codes Made Simple from Samuel Windsor will answer your questions about men's attire for any function.

Want to look the business? This visual guide to men’s dress codes helps you guarantee an impeccable appearance at any function.

Why can’t you wear a watch with white tie? Is a pinstripe suit or blazer best for business? Are brogues or Oxford shoes most suited to smart casual?

Our infographic below solves these and other dress code conundrums in seconds.

Simple use of illustrations to help make a dry topic significantly more engaging for readers. Infographics don't always need big, numerical datasets to be able to visualize information.

Thanks to Jenny for sending in the link!

Wednesday
Dec172014

An Illustrated Guide To The Galaxy Of Women's Shoes

An Illustrated Guide To The Galaxy Of Women's Shoes infographic

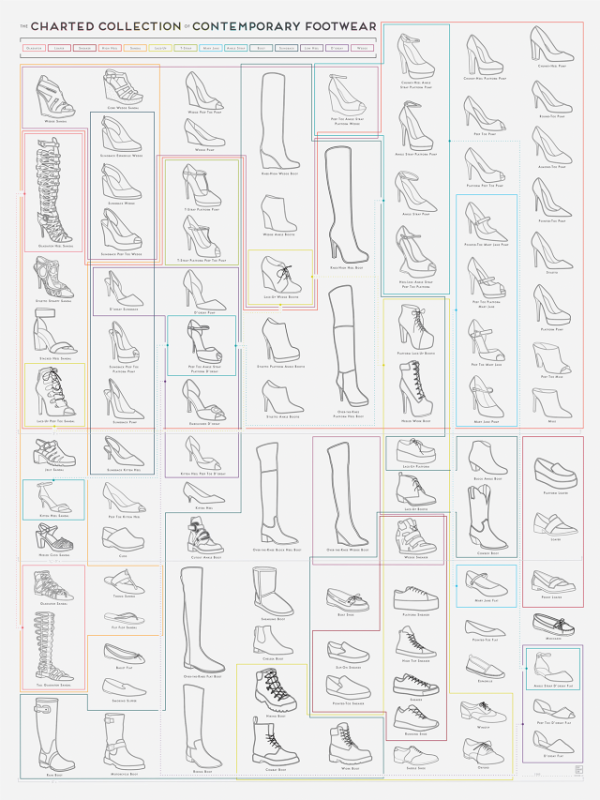
An Illustrated Guide to the Galaxy of Woman’s Shoes is the all knowing cheat sheet to any shoe that a woman could wear. Created by Pop Chart Lab, the color coding around the shoes d distinguishes the categories that each shoe falls under.

Can’t tell the difference between a slingback espadrille wedge and a peep-toe ankle strap platform wedge? The prolific infographic design studio Pop Chart Lab has you covered. The Charted Collection of Contemporary Footwear is a handy, color-coded cheat sheet of the many shoes the modern woman might go sauntering—or, in some cases, teetering—out of the house wearing.

It just boggles my mind.

Found on http://www.fastcodesign.com/

Wednesday
Aug202014

Why are Superior's Cotton Threads 'Superior'?

Why are Superior's Cotton Threads 'Superior'? infographic

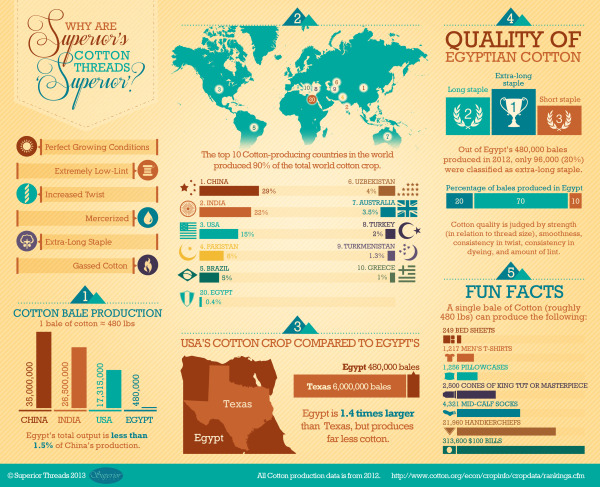
An infographic with information about Superior’s cotton from Egypt, Why are Superior’s Cotton Threads ‘Superior’? created by Superior Threads. This infographic focuses on comparing Egypt’s cotton to other cotton growing countries.

We created an infographic which explains why Egyptian-grown Cotton is so fantastic. Our Cotton threads are truly made from Cotton plants which are grown and harvested in Egypt.

Egyptian-grown extra-long staple Cotton

We put a lot of emphasis on ‘Egyptian-grown extra-long staple’ as a description for our Cotton threads. This is because the highest quality cotton available is Egyptian-grown extra-long staple Cotton when it comes to the textile/thread industry. ‘Extra-long staple’ means less lint and stronger thread. Egypt has the perfect growing conditions for Cotton and the result is a naturally strong and beautiful fiber.

The infographic gets straight to the point with answering its question about what makes Superior’s cotton so great. You can see in the text blurb above that Superior’s cotton comes from Egypt; however, it is not stated anywhere in the infographic.  So that information is lost when people share the infographic by itself.  Infographics take on a life of their own online, and all of your information needs to be included in that image file.

This is a great example for product companies.  Every product has a story about what consumer need it fills, or how it compares to the competition.  Companies should be using more infographic to help tell those stories to their potential customers. 

Thanks to Betsy for sending in the link!

Monday
Aug192013

Evening Etiquette: A Gentleman's Guide

Evening Etiquette: A Gentleman's Guide infographic

Gentleman is not just a title, it is a way of life. The Evening Etiquette: A Gentleman’s Guide infographic created by Boisdale explains the finer points to being a Gentleman. The infographic shares tips on how to look the part, what to wear, and dinner advice.  A great follow-up to the last post about matching ties.

Being a gentleman is more than opening the door for the ladies. For men to truly live up to this title, they must look and act the part in all areas of life -  from grooming, style and culture to knowledge of food and booze and the proper treatment of women.  Making these gestures a natural part of one’s behaviour is how a true gent stands out from the boys.

In order to help lads mature into men of virtue, Boisdale has created an evening etiquette guide. From knowing one’s tweed and collars to the proper table setting and whiskey protocol, this infographic will turn those willing into a man ladies want and other men aspire to be.

Another great visual explanation, that shows the reader the information with illustrations and images instead of spelling out the information with too much text.

Thanks to John for sending in the link!

Tuesday
Aug132013

How to Match Shirt and Tie Patterns

How to Match Shirt and Tie Patterns infographic

If you have some trouble balancing your serious business side with your fun side, a look at the How to Match Shirt and Tie Patterns infographic could be helpful. The infographic from Beckett Simonon shows a few examples of complicated patterns that work together, and then some to definitely stay away from.

So you’ve been wearing solid ties and shirts for a while, you think you look great but you feel is time to earn some extra style points by adding some patterns? No worries, we got you covered! Shirt and tie patterns are great if you want to stand out from the crowd, they are also fun and will bring a new life to your look. Just make sure your pattern groupings are far from making people dizzy and fall hypnotized. We made this cheat guide so you can learn the basics and develop your own combinations and style from there. Enjoy!

Great visual explanation design that stays focused, and tells one story really well.

Thanks to Nicholas for sending in the link!

Friday
Jun282013

Ba-tee-nga: Sheldon Cooper Presents Fun With Tees

Bah-tee-nga: Sheldon Cooper Presents Fun With Tees infographic

Ba-tee-nga: Sheldon Cooper Presents Fun With Tees infographic from RIPT Apparel shows every t-shirt that Sheldon Cooper from Big Bang Theory wore each episode of every season.

We have all seen The Big Bang Theory, and its awesome cast of nerds. But did you ever wonder about Sheldon’s graphic tees and how many different ones there actually were? This weeks infographic takes a look at the many shirts of Sheldon Cooper titled “Ba-TEE-nga: Sheldon Cooper Presents Fun With Tees”. Much like RIPT Apparel’s graphic tees, this is a mash-up of the famous saying Sheldon made popular; “Bazinga”, coupled with his awesome web show – “Sheldon Cooper Presents Fun With Flags”. The graphic shows all of Sheldon’s shirts from the pilot episode through season 6 episode 7. Yeh that’s a ton of Tees!

An ideal topic for an infographic!  Can you imagine how boring this would have been as a text list in a blog post?!? 

Thanks to Bill for submitting the link via Twitter!  Bazinga!

Tuesday
Nov272012

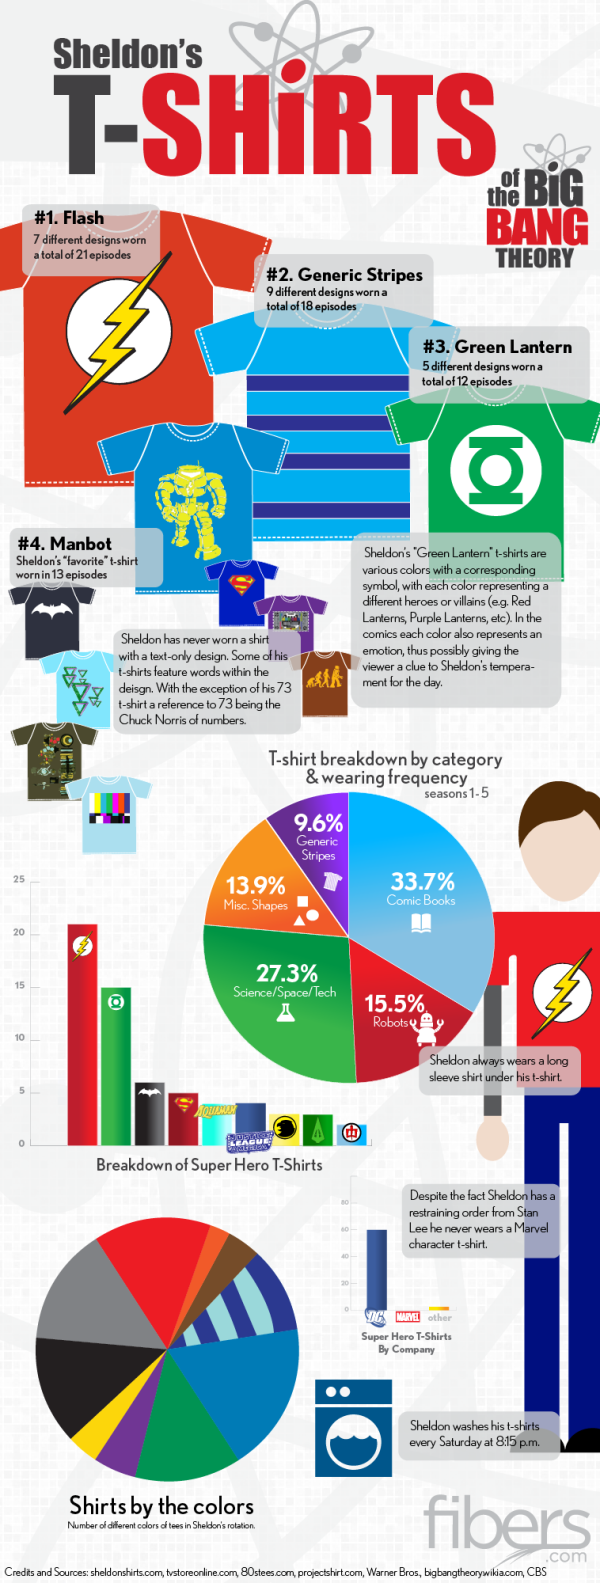
Sheldon's T-Shirts of The Big Bang Theory

Sheldon's T-Shirts of The Big Bang Theory infographic

If you have seen the comedy show The Big Bang Theory, then you know Sheldon…. If you haven’t seen it, go watch it and get back to us.  Have you ever noticed his wardrobe?  The Sheldon’s T-Shirts infographic from fibers.com tells you his favorite shirts, how often he wears his shirts, and even what colors he wears the most! 

Graphs, Charts and illustrated T-Shirts with correlating sizes to wearing frequency - would there be any other way to visualize Sheldon Cooper’s t-shirt collection from The Big Bang Theory? We think not.

Big thanks to Sheldon’s Shirts where we got most of the data for this graphic. You can find a lot of Sheldon’s Shirts for purchase on the following websites:

This is just a fun infographic that uses some data visualization to appeal to fans of the show.  Good design using publicly available data that has been complied in an engaging way.

The charts actually very well done.  Charts are color-coded to match the data.  Icons are included on the bars or in the pie slices, so no chart legends are needed.  This makes the data faster and easier to understand.

Found on Fibers.com

Monday
Aug272012

The Visual History of Swimwear

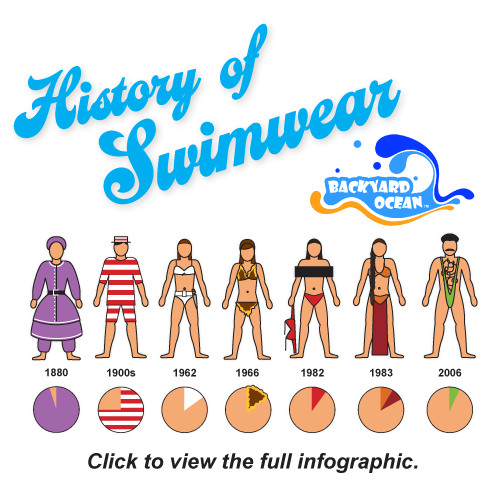
The History of Swimwear Swimsuits infographic by Backyard Ocean

The History of Swimwear infographic is a visual timeline from Backyard Ocean that shows the evolution of the swimsuit over the last 150 years.

The swimsuit: a symbol of stylish summer fun. Parade it on the beach or in the privacy of your above ground pool at home. Swimwear’s history has grown from cavemen furs to science fiction fancies. Artsy, classy, conservative or sexy, the swimsuit is an icon of summer style and fashion. Backyard Ocean takes a breath from swimming to see just how the swimsuit has changed through time. CLICK on the image to enlarge!

The History of Swimwear Swimsuits infographic by Backyard Ocean

This is a design by Jeremy Yingling with InfoNewt (my company).  Each model on the timeline has an illustration showing off the fashions, and represents either a new suit design or a famous example from TV & movies.  My favorite part is the associated pie chart visualizing the amount of skin coverage for each swimsuit (or lack thereof).

The design also plots the amount of skin coverage over time, the evolution of the “thong” and how skin exposure does not automatically equate to higher sex appeal.

Thanks to the team at Backyard Ocean!