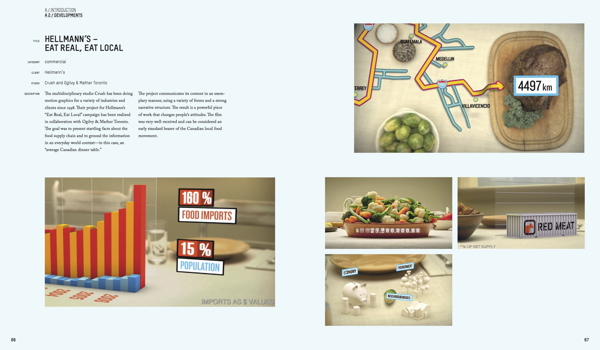
Using a Sankey diagram, the visualisation charts the percentage breakdown for food poisoning outbreaks by national cuisine, food type, pathogen/toxin and contributing factor where the cuisine type was known.
The diagram concludes with the “most lethal combination”, highlighting the top factors that led to an outbreak.
I thought it would add context to frame the Sankey diagram in a human body, as though it was being eaten and spreading through the body like a disease.
I really like this approach to a Sankey Diagram that breaks the original total into four different categories of data.
Here at Popular Science, we’re big fans of visualizations—those often beautiful and always illuminating intersections of science and art. So we’re thrilled to announce a new partnership with the National Science Foundation called The Vizzies.
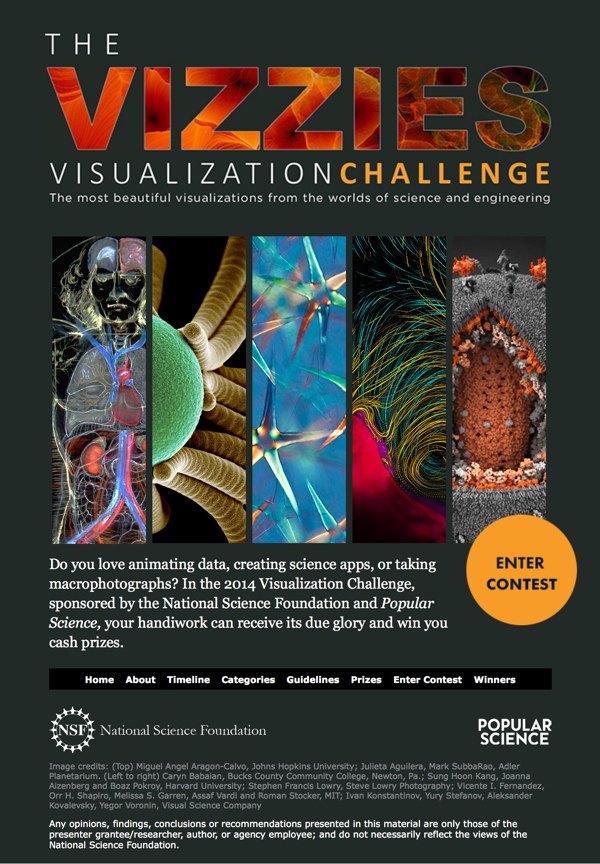
Do you love animating data, creating science apps, or taking macrophotographs? In the 2014 Visualization Challenge, sponsored by the National Science Foundation and Popular Science, your handiwork can receive its due glory and win you cash prizes.
The Vizzies is the newest iteration of the NSF’s annual International Science and Engineering Visualization Challenge, which has honored some amazing stuff in the past. They’ve hosted the contest for more than a decade, and this year we’ve joined forces with them so that you, dear reader, will have the opportunity to enter. Macrophotography, animations, data visualizations, even science games—we want them all! A panel of experts will judge the entries, and the winners in each of five categories will be featured in the pages of Popular Science (oh, and you’ll also get cash).
Visualization Challenge participants can submit their entries in one or more of five categories: Photography, Video, Illustration, Posters & Graphics and Games & Apps. The Experts’ Choice winner in each category will be awarded $2,500, and a People’s Choice prize of $1,000 goes to the best overall entry.
If you are designing data visualzations or using visuals to communicate any scientific research, they want you to enter your designs into the challenge. The visuals can be videos, photos, games, apps or graphics.
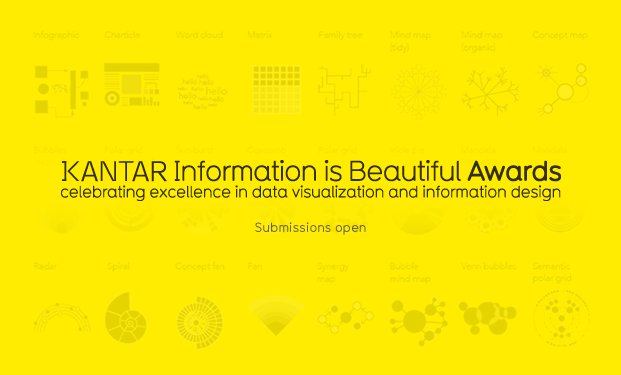
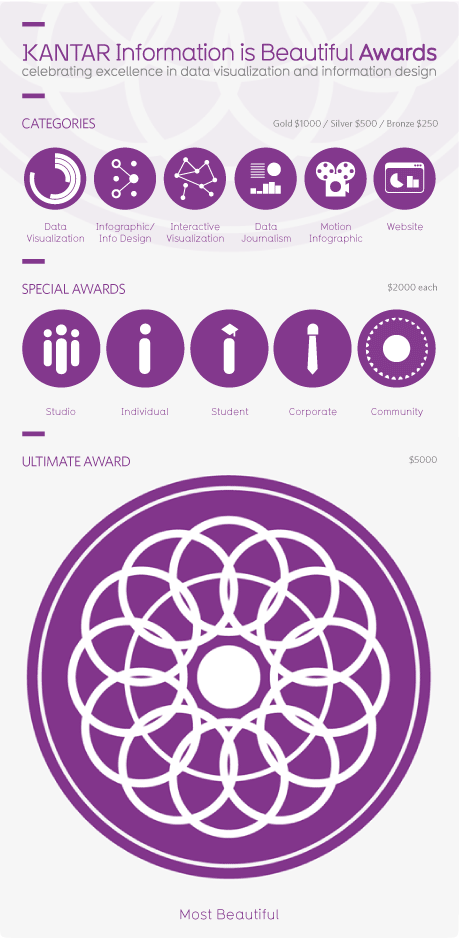
The deadline for submitting design entries to the Information is Beautiful Awards is this Friday, September 13th. Anyone can enter and the available categories are:
Data journalism
Data visualization
Infographic/information design
Interactive visualization
Motion infographic
Website
The Kantar Information is Beautiful Awards celebrate excellence and beauty in data visualizations, infographics and information art.
Last year we awarded 26 prizes across 6 categories and 8 special awards with entries from more than 20 different countries. The standard was exceptionally high and we really appreciate the effort people put into entering the awards.
The Awards were set up in 2012 by David McCandless, journalist and datavisualizer, in collaboration with Aziz Kami, Creative Director, Kantar.
The Awards are non-profit and community-driven – that means you don’t need to shell out a big wedge of cash to enter your work, and if you’re successful, you won’t need to shell out again for a fancy sit down dinner awards night.
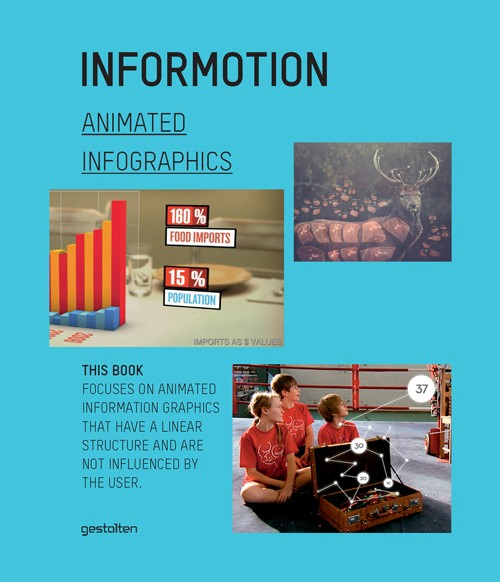
from Informotion: Animated Graphics, Copyright Gestalten 2012
The Informotion: Animated Infographics book edited by Tim Finke, Sebastian Manger and Stefan Fichtel was just released from Gestalten, and only recently appeared in the U.S. I also have a promotional copy of the book to giveaway! So keep reading until the end to find out how to get a chance to win the book.
from Informotion: Animated Graphics, Copyright Gestalten 2012
This is the only book I am aware of that focuses on infographic animation and video production. The book covers topics like Forms of Representation, Storyboarding, Animation, Voice-Over Narration and Content. The book also highlights at least 25 animated infographic videos, and takes a deep look at how they were made.
At the nexus of design and journalism, the field of information graphics offers some of the most exciting and dynamic work for creatives. Today, even more so than static versions, animated information graphics are serving to communicate complex correlations succinctly. The production of such animations on the basis of up-to-the-minute data is already common practice in select TV programs. Now, these moving formats are finding wider application in television and on the internet, as well as on an increasing number of mobile devices, and in public places. They can be seen in editorial contexts and in the areas of advertising and corporate communication.
Informotion is the first book to document the fundamentals needed to create compelling animated infographics and to explain them with numerous examples. It focuses on key aspects of visualizing data, current forms of information graphics, and future possibilities for moving images. The publication also outlines the factors that improve the viewer’s ability to absorb information.
from Informotion: Animated Graphics, Copyright Gestalten 2012
Sebastian Manger was kind enough to provide some of his time to answer a series of interview questions about the future of infographic videos and production of the book:
CI: What brought you, Tim Finke, and Stefan Fichtel together to collaborate on the book?
Sebastian
Manger: Tim and I both studied communication design at the University of Applied Sciences in Potsdam near Berlin. Our collaboration on many projects during our studies welded us together as team, and so we decided to do our master’s thesis as a joint project as well. This thesis formed the initial basis for Informotion. During our research for the book we came into contact with Stefan Fichtel. We initially just wanted to interview him about his experiences in the field of information graphics, but we then wound up working with him more closely.
CI: You cover this briefly in the book, but how do you define the difference between data visualizations and infographics?
Sebastian
Manger: Data visualization is mostly based on a very complex set of data, which is then transmitted by tools such as processing into a graphical representation. Examples can include user behavior in a certain context or the air traffic in a given airspace. In our opinion, an infographic is more concentrated on a particular piece of information that needs to be communicated. In contrast to data visualization, infographics often boil something down to one core message that is then conveyed.
CI: Who do you see as the primary audience for the book?
Sebastian Manger: The book is a guide for designing animated infographics. Therefore, the primary target group is, of course, designers who create those. But Informotion is actually also interesting for any designer who deals with the transfer of information through moving images because it deals with our general perception of animation. The book introduces the range of tools now available for implementing animated infographics and explains their appropriate use.
In addition, Informotion is also very interesting for journalists. They can gain valuable insight into how the information they first researched can be processed into an animation. This insight can then help avoid misunderstandings in any future collaboration.
CI: How difficult was it to select the videos in the book and did you get support from the companies that produced the videos?
Sebastian Manger: In some cases, the choice was indeed very difficult—especially when we needed examples focusing on a particular means of implementation. In those cases, we needed scenes that showed exactly what was meant without getting overlayed by other effects or information. In our thesis, which was the original inspiration for the book, we simply created such specific examples ourselves. For Informotion, however, we wanted to always use current examples from actual practice.
Once we found a fitting example, it was usually quite easy to convince the agency or studio to participate in the book. It was, however, sometimes a bit difficult to figure out who exactly was the author of a certain animation.
CI: Based on what you have observed, is there a “best practice” method for releasing an infographic video on the Internet?
Sebastian Manger: As the field of animated infographics is still quite young, it is currently very difficult to speak of a “best practice” example. We do hope that our book can help generate such an example one day.
CI: Do you believe that infographic videos are a stronger tool than static image or interactive infographics?
Sebastian Manger: Yes, we do. People’s viewing habits are changing more and more. Ever more videos are appearing on the internet (YouTube, Vimeo, etc). The viewer is already getting used to absorbing information more passively. This environment is very favorable for the use of animated infographics. A certain fact can be presented to viewers in a simple manner without the need for them to toil through charts or diagrams themselves.
But herein also lies a danger or a special responsibility for the designer of an animated infographic. Under these conditions, a given set of information must always be reduced to a few details. In a static infographic, a statistic for example, viewers can make conclusions by themselves—provided, of course, that they take the time to do so.
CI: How quickly are infographic videos growing as a communication tool?
Sebastian Manger: In our research over the last few years we have ascertained a clear increase in the use of animated infographics. A simple indicator of this, for example, is the increasing number of videos tagged as “animated infographics” on YouTube or Vimeo. The number of websites and blogs that feature animated infographics is also growing continuously.
In addition, infographic design elements are being used more and more frequently in music videos, commercials, main titles, etc. This paves the way for consumers to deal with infographics as a means of implementation. Of course, the use of graphic elements in these fields is currently mostly limited to decoration, but why can’t it expand over the next few years and become more professional? These circumstances are causing viewing habits to change. Designers not only have a significant interest in these changes, but are also a contributing factor to them.
CI: What do you see as the future of infographic videos?
Sebastian Manger: We expect that the trend just described in our previous answer will continue and that animated infographics will be used even more frequently—especially in fields such as reporting but also in advertising. For most people, the use of information graphics is an indicator of seriousness. However, interactive graphics and data visualization will certainly play a huge role too.
CI: How difficult was it to put together a paper book about the highly visual topic of infographic videos?
Sebastian Manger: Not very difficult. Informotion includes a login code for accessing a password-protected website from where you can watch all the referenced videos in full length. In the printed book we use screenshots from and explanations of these videos to identify and explain current theories and means of implementation.
CI: Do you have any plans for a video infographic about video infographics in the future?
Sebastian
Manger: Not until you came up with this question, but we’ll surely think about now!
Free Copy of the Book:
I have two copies of the book to give away to readers of Cool Infographics. To enter you name into the hat, tweet a link to this blog post on Twitter and include the hashtag #informotionbook so I can find the Tweets. At noon on Friday, July 13, 2012, I will randomly choose two people from the Tweets to receive a copy of the book. You need to be following me (@rtkrum) on Twitter so I can send you a Direct Message (DM) if you are selected.
Here’s an example Tweet that would qualify:
Check out Informotion, the new book about animated infographic videos bit.ly/OdaGTg #informotionbook
Thanks to Sebastian for all his hard work, and participating with the interview.
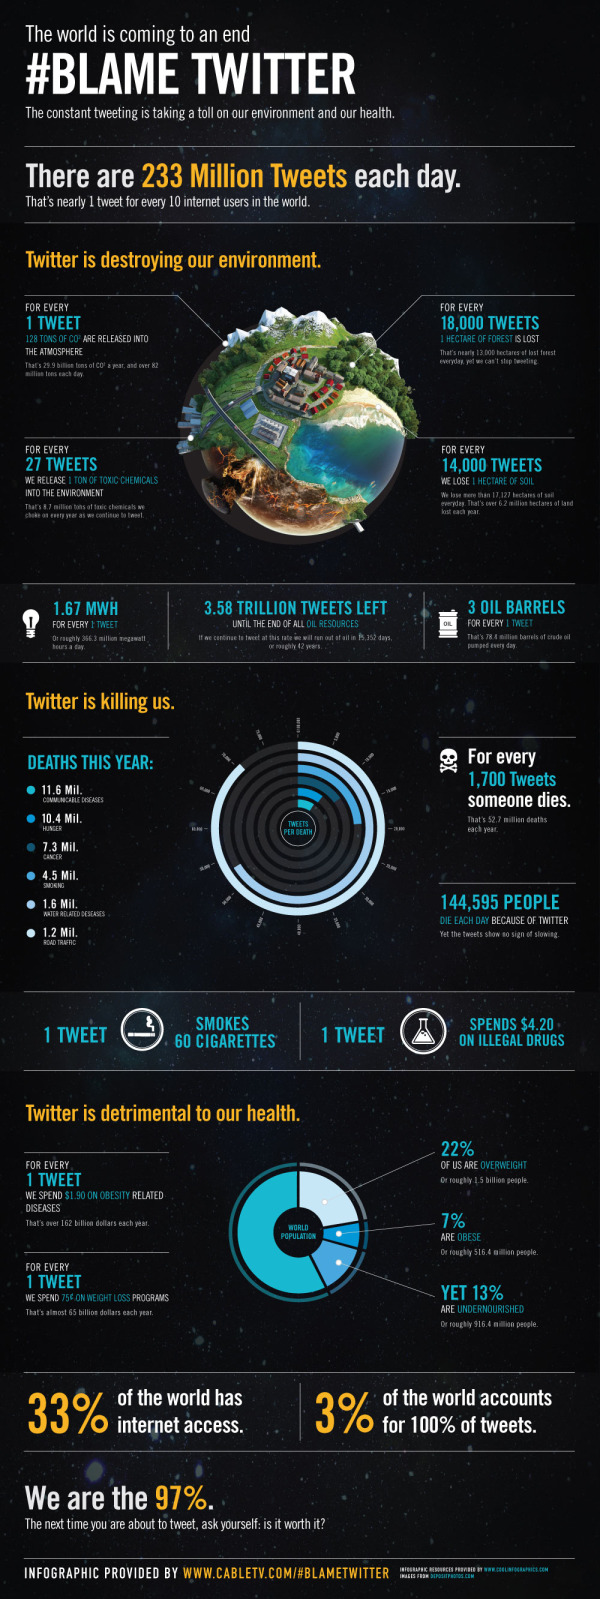
All claims in this infographic are obviously false in nature and are solely intended for the comedic entertainment of readers. We <3 Twitter.
From PosterBrain:
We are sending a HUGE shout out to Tim Cooley for winning our Design the Future Infographic Contest! His infographic, #Blame Twitter, is very creative, informative, visually pleasing, and incredibly well done! We will definitely think twice about what, and how often, we tweet! Congrats again Tim, and thanks to everyone who participated!
Tim took the real data provided for the contest, but fictitiously correlated it to Twitter statistics. In a classic example that “Correlation does not imply causation”, Tim visualized the real-world statistics as if they were caused by Twitter. For example, it is true in the real-world that nearly 13,000 hectares of forest is lost every day, but it has nothing to do with the 233,370,615 Tweets every day.
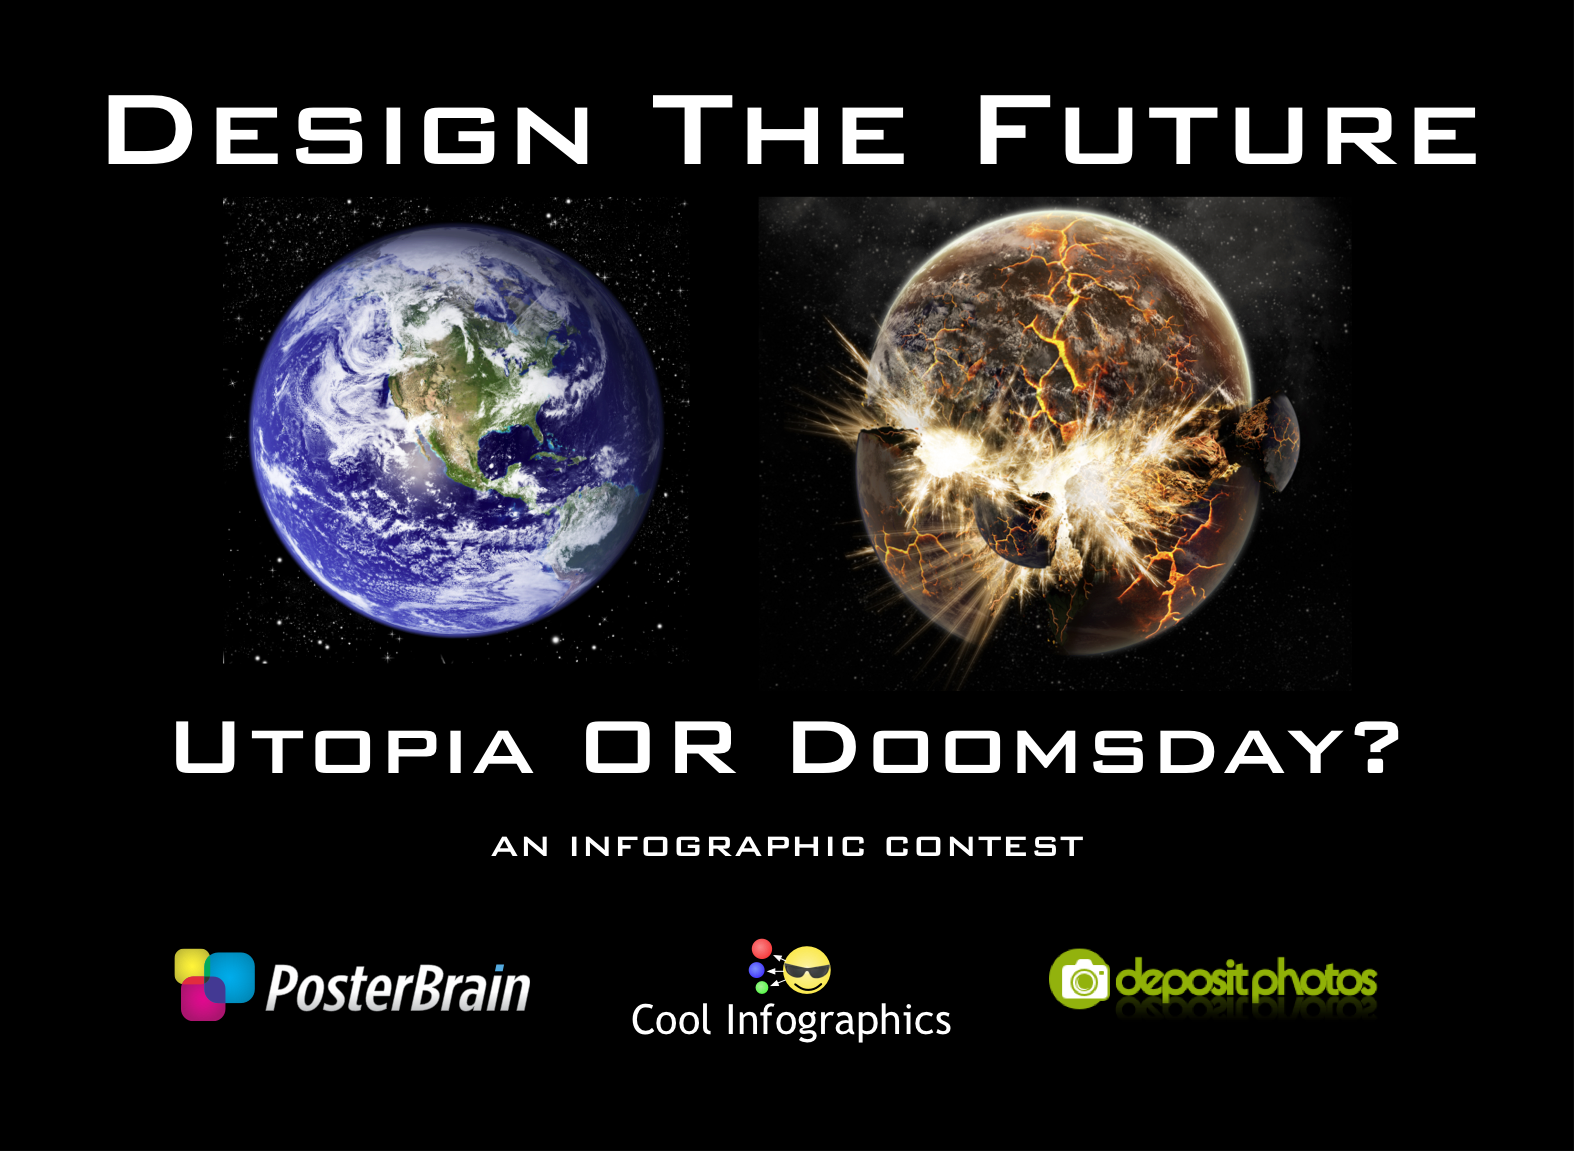
Hosted here on Cool Infographics, PosterBrain.com is sponsoring the Design The Future infographic contest for the best Utopia or Doomsday infographic poster. The grand prize will be a 16GB iPad2. Plus random prizes will be awarded throughout, no matter what everyone will get something. Instead of giving you a subject for the infographic we will provide the data and you will create your own subject. Data MUST be pulled this data spreadsheet available on Google Docs. THIS IS THE ONLY SOURCE you can gather data for your infographic from. Judging will be based on creativity, aesthetics, clarity and the story that your infographic tells.
Contest will end when they receive 50 Entries! So act fast!
Of course you can create you own illustrations and visualizations, but DepositPhotos.com is offering a free, PROMO CODE to all designer participants. This promo code gets you FIVE FREE images to use in your design!
Click here for all of the Official Contest Page with of the details.
Once you submit your entry, 33% of the judging criteria will be on how many people “LIKE” your image on our Facebook contest page. Once you email in your entry, PosterBrain will post them on the Facebook page so you can start gathering LIKEs.
Everyone is encouraged to enter, so even if you have never designed an infographic before, this is your opprtunity. Plus, PosterBrain will be awarding some random prizes to participants
Update on Friday, November 25, 2011 at 4:41PM by
Randy
Open to international entries!
The contest sponsor (PosterBrain) has heard the the comments about restricting the contest to U.S. residents, and has now modified the rules to allow entries from around the world! See the Official Rules for details!
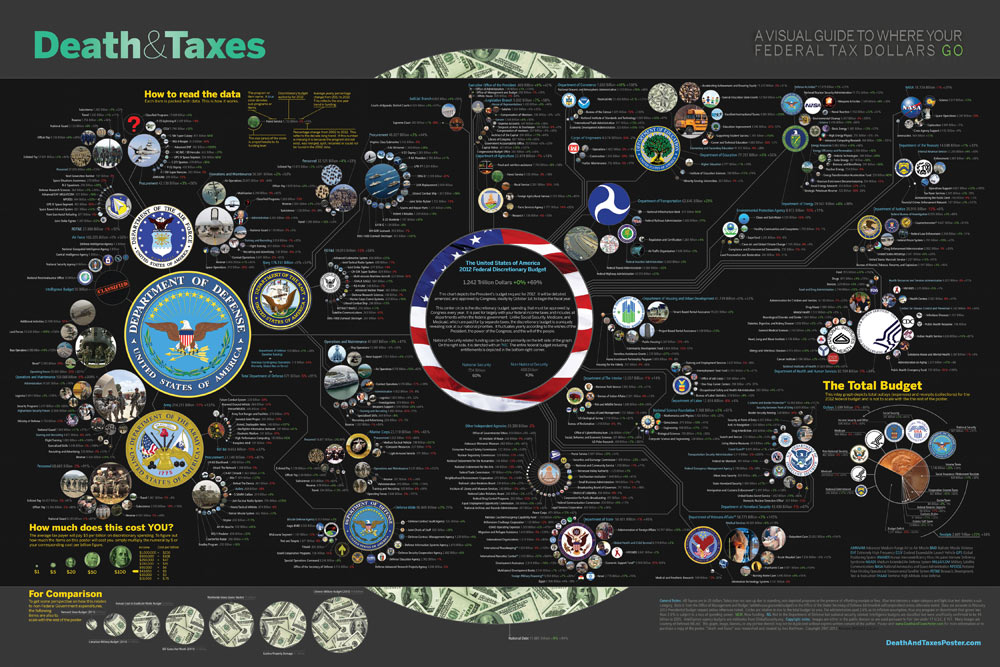
The new 2012 Death & Taxes poster has been released, and this year it’s better than ever. Designed by Jess Bachman (ByJess.net) this poster visualizes the 2012 proposed U.S. Federal Budget. The Death & Taxes poster is one of the best infographics I’ve ever seen, and it gets better every year.
“Death and Taxes” is a large representational graph and poster of the federal budget. It contains over 500 programs and departments and almost every program that receives over 200 million dollars annually. The data is straight from the president’s 2012 budget request and will be debated, amended, and approved by Congress to begin the fiscal year. All of the item circles are proportional in size to their funding levels for visual comparison and the percentage change from both 2012 and 2002 is included so you can spot trends.
PURCHASE: This year, Jess also had the opportunity to partner with Seth Godin and his Domino Project to make the full-size 24” x 36” poster available for purchase through Amazon. Currently, you can purchase a copy of the poster for $19.99. Also, check out Jess’s video introduction on the Amazon page.
POSTER GIVEAWAY: Cool Infographics is giving away one FREE copy of the poster. The free poster will go to one randomly chosen person that tweets a link to this blog post on Twitter and includes the hashtag: #deathandtaxes. I included the hashtag in the post title, so any retweets will be automatically eligible. NOTE: you must also be following me on Twitter (@rtkrum) so that I can send you a direct message if you have won!
I will choose the winner at 12 noon (Central Time) on Friday, November 11, 2011 (11/11/11). I will contact the winner, and order the poster from Amazon to be delivered to the winner.
INTERVIEW: Similar to last year, Jess was willing to answer some behind-the-scenes questions about this year’s poster:
Cool Infographics: What’s the most interesting thing you learned from the 2012 data?
Jess Bachman: Lots of reductions in the military side. It’s mostly from the OCO war funding, but its interesting to see what actually is getting cut the most. Mostly Army funding and RDT&E across the board. I would think the OCO was mostly Operations and Procurement.
Cool Infographics: Has you design process changed at all this year? What software did you use to help dig through the data and create the design?
Jess Bachman: Well this year I tried to work exclusively within the official spreadsheets, rather than pick out the numbers from the paper (PDF) budget. I think it’s more accurate and easier to get totals. Mainly just used excel and photoshop as always.
Cool Infographics: When did the 2012 data become available, and how long did it take you create this year’s poster?
Jess Bachman: It was supposed to be released in February but it was a month late. I started moving on it at a full clip then got involved with Amazon/Godin and the timelines shifted quite a bit, so while I usually get the post out in April, it was released in September this year.
Cool Infographics: How did working with Seth Godin and the Domino project come about?
Jess Bachman: Seth just emailed me out of the blue. We talked and it seemed like a no-brainer.
Cool Infographics: How does working with Amazon and the Domino project change how you print and distribute the poster?
Jess Bachman: Well previously my Mom did most of the shipper and I also had a 3rd party do fulfillment and shipping. It’s a rather time consuming and frustrating process. Sending out orders, doing customer support, paying vendors, etc. Now it’s all in Amazon’s hands. They got it printed and of course are warehousing and shipping it too. I’m quite glad as they do a much better job of shipping than I do. Of course they also take their cut of the profits. As for Domino, they have their own distribution channels and lists and also work closely with Amazon to make sure the product page is well presented too. This year it reached #18 on the best sellers list. I guess that makes me a best selling author. I don’t think I could have accomplished that without Domino/Amazon.
Cool Infographics: I see you made a video to include on the Amazon page, how was that experience?
Jess Bachman: Seth told me they needed a video ASAP so I just made one that afternoon. I suppose I would put more effort into it next year but videos help sell products and i think it does a good job of that.
Cool Infographics: Any new design features added to the poster this year?
Jess Bachman: I wanted to include some non-governmental items in the poster this year for reference. They are in the bottom left and include things like the size of the video game industry, bill gate’s net worth and other such things. When talking about billions of dollars all the time, sometimes you need to get out of government-mode to put those figures into further context.
Cool Infographics: The past posters have been shared very heavily in social media, which social sharing sites have you found most successful?
Jess Bachman: Well, Digg has traditionally been a big asset, but then Digg fell apart so I no longer pay attention to it. In general, I have abandoned the traditional accelerants like Digg, reddit, etc. and instead focus on my network of bloggers and influencers. Combine that with Facebook liking and you can really spread something.
Cool Infographics: Last year we talked about some favorite places that have the poster on display. Any new ones this year?
Jess Bachman: Well, with a larger audience and hopefully more sales, the poster will be everywhere. Unfortunately, I get lots of requests for discounts for schools with tight budgets, but I have no control over price anymore. I can say that an iOS app is in development so that will be interesting. My ultimate goal is to get on the Daily Show to talk about the poster in April. People constantly tell me I need to be on there, and I’m a huge fan, so I figure I have a good shot, just need to nag the right people.
Postgrad.com is sponsoring a data visualization contest using data gathered by David McCandless. There’s a brand new iPad2 for the winner, and the top 3 will receive signed copies of ‘Information is Beautiful’ by David McCandless.
It Started With A Tweet…
Data journalist and information designer, David McCandless recently gathered data revealing surprisingly low numbers of black students accepted into Oxford and Cambridge. However, despite being genuinely passionate about the data, David didn’t have time to visualise it himself. So he posted the following message on Twitter…
We contacted David and offered to put up a prize as a competition for the best visualisation of this data. To our delight, David accepted our offer.
Like David, we feel strongly that this data should be made visible to many. And we’re challenging you to do it.
UPDATE: Although the initial findings related to the number of black students, there’s a lot of information within the datasets about the ethnic heritage, and socioeconomic background of students attending different institutions. You are free to pick out whatever story you wish and present it in a visual format.
Enter Now To Win…
It’s easy to enter the competition and you could win:
Recognition from our panel of industry experts in journalism, data visualisation and design
Your name and work promoted across the web
A proud and noteworthy addition to your portfolio, website or CV
A full post profiling you and your work, and the design process you followed
A signed copy of Information is Beautiful by David McCandless
A brand new iPad2
Expert Judges From The BBC, .net Magazine And More…
Assisting David in the judging, we are thrilled to have judges from the BBC, .net Magazine, Tableau Software, Visualising Data, and marketing agency 97th Floor.
The judges will consider a range of criteria including design, effective visualisation, and presentation of the story.
Andy Kirk, Founder, Visualising Data Ltd
Chris Bennett, President, 97th Floor
David McCandless, Author, Information is Beautiful
Elissa Fink, VP Marketing, Tableau Software
Katherine Mann, Director, Postgrad.com
Rob Bowen, Art Editor, .net Magazine
Russell Smith, Editorial Development, BBC News
It’s An Open Brief
The competition is based on the data collected by David, and other sources listed within the dataset. However, you are free to mashup the data with any other source you wish, provided the sources are publicly available and cited in your entry to the competition.
Your visualisation can be static, moving or interactive
You can include as little or as much text as you like
It can be as simple as a single chart or a full-blown infographic
You’ve A Good Chance of Winning…
People are often put off entering competitions assuming there will be hundreds of entrants. In reality, this is rarely the case. Simply entering really could put you in the running for a prize.
There’s a brand new iPad2 for the winner. And the top 3 will receive signed copies of ‘Information is Beautiful’ by David McCandless.
Entries from amateurs and newbies are very much welcome. We’d love to see what you come up with.
Remember, it doesn’t have to be a masterpiece. A simple yet effective piece of visualisation could be just the ticket.
And all highly recommended pieces, will receive recognition by our expert panel alongside the winners when results are announced.
You can grab the data here (be sure to check out the other sources listed within it).
To enter the competition, simply email your visualisation as a jpeg attachment to mark.johnstone@postgradsolutions.com and include your Full Name and the best email address to reach you on. As an alternative to sending your entry as an attachment, you are welcome to post your entry on your own site, and simply send us the link. In fact, we’d love it if you did that.
If your entry is interactive or moving, you will have to publish it on a separate site (your own site is preferable but social sites like YouTube are perfectly acceptable). Just remember to send us the link.
The competition closes at 11pm GMT on Monday 20th June 2011.
Winners will be announced by Monday 4th July 2011.
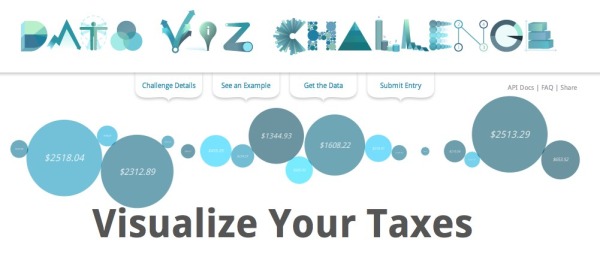
Every year, Americans fill out income tax forms and make a payment to the IRS. It’s an important civic duty, but it is also a lot of money. Where does it all go? Using data provided by WhatWePayFor.com, we challenge you to create a data visualization that will make it easier for U.S. citizens to understand how the government spends our tax money.
The Deadline: Submit your entries by midnight of March 27, 2011. Finalists will be announced the week of April 11, and winners will be publicly announced on Tax Day (April 18, 2011).
Participants must be residents of the U.S., which is an issue for many would-be designers.
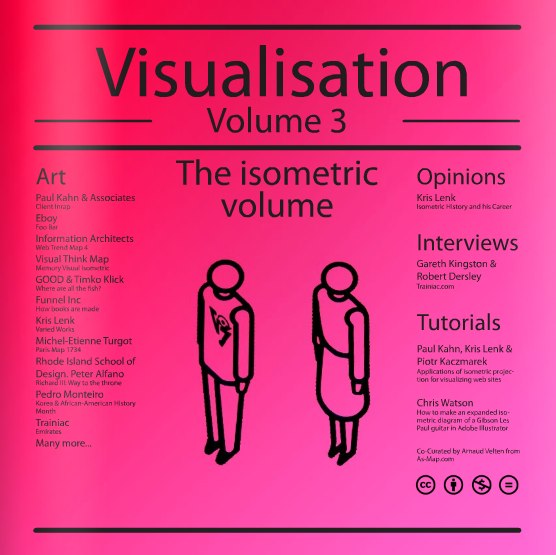
This is the group to share your submissions for the contest to feature your work on the Cover (front wrapping round to the back), a double page spread and a blog post on GOOD Magazine blog, Vism.ag/blog and CoolInfographics.com. I want to emphasize handmade techniques like, etching, screen printing, metal press, lino, mono printing, drawn, paper folding. the only digital element would be the capturing of the work for the front cover to send us, or taking printed elements and manipulating them by hand… to an extent.
CHECKOUT THESE PEOPLE FOR INSPIRATION:
Stefan G Bucher
Denis Wood & Siglio Press
Grayson Perry
Stefanie Posavec
Sara Fanelli
Amy Franceschini
Alfred Wainwright
VENTURI, SCOTT BROWN AND ASSOCIATES, INC
Visualise any subject you like (try not to be too offensive, would like all ages to appreciate) and to consider the:
Complexity Innovation Culture
TO BE JUDGED
by GOOD Magazine, Density Design, Cool Infographics & Visualisation Magazine
End date: aiming for end of December.
Judging: Beginning of January
Dont’ be intimidated if you’re not an infographic designer by day. This contest is open to everyone who thinks they can tell a good message visually. Judging will be based on these criteria:
Complexity: More complexity doesn’t always equal better infographic. Does the infographic improve understanding of a normally complex topic?
Innovation: Is the visual design method innovative, and visualize the data in a new way?
Culture: Is the infographic relevant to a broad audience in today’s world? Does it have cultural importance?
Since I’ll be one of the judges, I can’t enter myself. I will probably post more than just the winner here on the blog. I expect the judging will be tough, and we’ll have a number of really good entries.
Please help spread the word and retweet the contest!


 Randy
Randy