Informotion: Animated Infographics - Interview & Book Giveaway
 from Informotion: Animated Graphics, Copyright Gestalten 2012
The Informotion: Animated Infographics book edited by Tim Finke, Sebastian Manger and Stefan Fichtel was just released from Gestalten, and only recently appeared in the U.S. I also have a promotional copy of the book to giveaway! So keep reading until the end to find out how to get a chance to win the book.
 from Informotion: Animated Graphics, Copyright Gestalten 2012
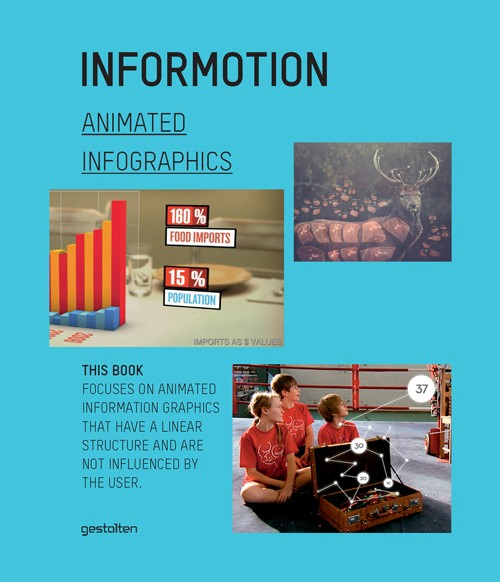
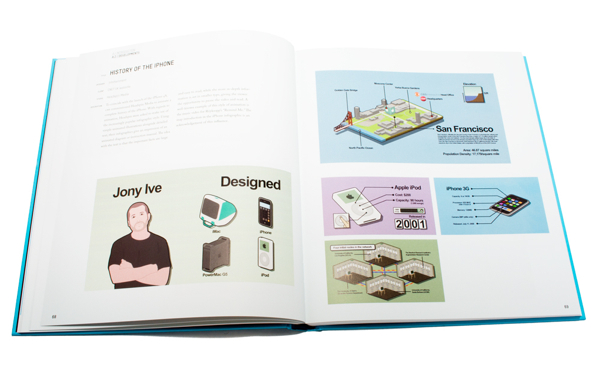
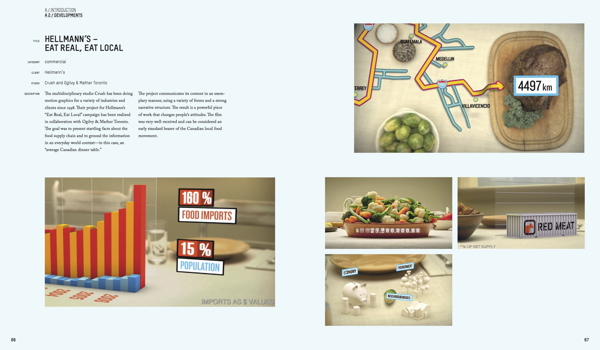
This is the only book I am aware of that focuses on infographic animation and video production. The book covers topics like Forms of Representation, Storyboarding, Animation, Voice-Over Narration and Content. The book also highlights at least 25 animated infographic videos, and takes a deep look at how they were made.
At the nexus of design and journalism, the field of information graphics offers some of the most exciting and dynamic work for creatives. Today, even more so than static versions, animated information graphics are serving to communicate complex correlations succinctly. The production of such animations on the basis of up-to-the-minute data is already common practice in select TV programs. Now, these moving formats are finding wider application in television and on the internet, as well as on an increasing number of mobile devices, and in public places. They can be seen in editorial contexts and in the areas of advertising and corporate communication.
Informotion is the first book to document the fundamentals needed to create compelling animated infographics and to explain them with numerous examples. It focuses on key aspects of visualizing data, current forms of information graphics, and future possibilities for moving images. The publication also outlines the factors that improve the viewer’s ability to absorb information.
 from Informotion: Animated Graphics, Copyright Gestalten 2012
Sebastian Manger was kind enough to provide some of his time to answer a series of interview questions about the future of infographic videos and production of the book:
CI: What brought you, Tim Finke, and Stefan Fichtel together to collaborate on the book?
SebastianManger: Tim and I both studied communication design at the University of Applied Sciences in Potsdam near Berlin. Our collaboration on many projects during our studies welded us together as team, and so we decided to do our master’s thesis as a joint project as well. This thesis formed the initial basis for Informotion. During our research for the book we came into contact with Stefan Fichtel. We initially just wanted to interview him about his experiences in the field of information graphics, but we then wound up working with him more closely.
CI: You cover this briefly in the book, but how do you define the difference between data visualizations and infographics?
SebastianManger: Data visualization is mostly based on a very complex set of data, which is then transmitted by tools such as processing into a graphical representation. Examples can include user behavior in a certain context or the air traffic in a given airspace. In our opinion, an infographic is more concentrated on a particular piece of information that needs to be communicated. In contrast to data visualization, infographics often boil something down to one core message that is then conveyed.
CI: Who do you see as the primary audience for the book?
Sebastian Manger: The book is a guide for designing animated infographics. Therefore, the primary target group is, of course, designers who create those. But Informotion is actually also interesting for any designer who deals with the transfer of information through moving images because it deals with our general perception of animation. The book introduces the range of tools now available for implementing animated infographics and explains their appropriate use.
In addition, Informotion is also very interesting for journalists. They can gain valuable insight into how the information they first researched can be processed into an animation. This insight can then help avoid misunderstandings in any future collaboration.
CI: How difficult was it to select the videos in the book and did you get support from the companies that produced the videos?
Sebastian Manger: In some cases, the choice was indeed very difficult—especially when we needed examples focusing on a particular means of implementation. In those cases, we needed scenes that showed exactly what was meant without getting overlayed by other effects or information. In our thesis, which was the original inspiration for the book, we simply created such specific examples ourselves. For Informotion, however, we wanted to always use current examples from actual practice.
Once we found a fitting example, it was usually quite easy to convince the agency or studio to participate in the book. It was, however, sometimes a bit difficult to figure out who exactly was the author of a certain animation.
CI: Based on what you have observed, is there a “best practice” method for releasing an infographic video on the Internet?
Sebastian Manger: As the field of animated infographics is still quite young, it is currently very difficult to speak of a “best practice” example. We do hope that our book can help generate such an example one day.
CI: Do you believe that infographic videos are a stronger tool than static image or interactive infographics?
Sebastian Manger: Yes, we do. People’s viewing habits are changing more and more. Ever more videos are appearing on the internet (YouTube, Vimeo, etc). The viewer is already getting used to absorbing information more passively. This environment is very favorable for the use of animated infographics. A certain fact can be presented to viewers in a simple manner without the need for them to toil through charts or diagrams themselves.
But herein also lies a danger or a special responsibility for the designer of an animated infographic. Under these conditions, a given set of information must always be reduced to a few details. In a static infographic, a statistic for example, viewers can make conclusions by themselves—provided, of course, that they take the time to do so.
CI: How quickly are infographic videos growing as a communication tool?
Sebastian Manger: In our research over the last few years we have ascertained a clear increase in the use of animated infographics. A simple indicator of this, for example, is the increasing number of videos tagged as “animated infographics” on YouTube or Vimeo. The number of websites and blogs that feature animated infographics is also growing continuously.
In addition, infographic design elements are being used more and more frequently in music videos, commercials, main titles, etc. This paves the way for consumers to deal with infographics as a means of implementation. Of course, the use of graphic elements in these fields is currently mostly limited to decoration, but why can’t it expand over the next few years and become more professional? These circumstances are causing viewing habits to change. Designers not only have a significant interest in these changes, but are also a contributing factor to them.
CI: What do you see as the future of infographic videos?
Sebastian Manger: We expect that the trend just described in our previous answer will continue and that animated infographics will be used even more frequently—especially in fields such as reporting but also in advertising. For most people, the use of information graphics is an indicator of seriousness. However, interactive graphics and data visualization will certainly play a huge role too.
CI: How difficult was it to put together a paper book about the highly visual topic of infographic videos?
Sebastian Manger: Not very difficult. Informotion includes a login code for accessing a password-protected website from where you can watch all the referenced videos in full length. In the printed book we use screenshots from and explanations of these videos to identify and explain current theories and means of implementation.
SebastianCI: Do you have any plans for a video infographic about video infographics in the future?
Manger: Not until you came up with this question, but we’ll surely think about now!
Free Copy of the Book:
I have two copies of the book to give away to readers of Cool Infographics. To enter you name into the hat, tweet a link to this blog post on Twitter and include the hashtag #informotionbook so I can find the Tweets. At noon on Friday, July 13, 2012, I will randomly choose two people from the Tweets to receive a copy of the book. You need to be following me (@rtkrum) on Twitter so I can send you a Direct Message (DM) if you are selected.
Here’s an example Tweet that would qualify:
Check out Informotion, the new book about animated infographic videos bit.ly/OdaGTg #informotionbook
Thanks to Sebastian for all his hard work, and participating with the interview.


 Randy
Randy
Reader Comments (2)