About
Randy Krum
President of InfoNewt.
Data Visualization and Infographic Design

Infographic Design

Infographics Design | Presentations
Consulting | Data Visualizations

DFW DataViz Meetup

Join the DFW Data Visualization and Infographics Meetup Group if you're in the Dallas/Fort Worth area!

Search the Cool Infographics site

Custom Search

Subscriptions:


Feedburner

The Cool Infographics® Gallery:

How to add the
Cool Infographics button to your:

Cool Infographics iOS icon

- iPhone
- iPad
- iPod Touch


Read on Flipboard for iPad and iPhone

Featured in the Tech & Science category

Flipboard icon

Twitter Feed
From the Bookstore

Caffeine Poster

The Caffeine Poster infographic

Entries in wine (10)

Monday
Aug282017

The Perfect Temperatures for Beer, Wine, Coffee and More

The Ideal Temperature for Beer, Coffee, and More infographic

The Perfect Temperatures for Beer, Wine and Beverages from GB Energy Supply is no longer visible on their site, but I was able to find it on LifeHacker.

I really appreciate infographics that tell one story really well. You want the information to be clear and easy to understand for the audience. Personally, I wish it was also available in Fahrenheit.

Wednesday
Aug242016

The Right Wine in the Right Kind of Glass

The Right Wine in the Right Kind of Glass infographic

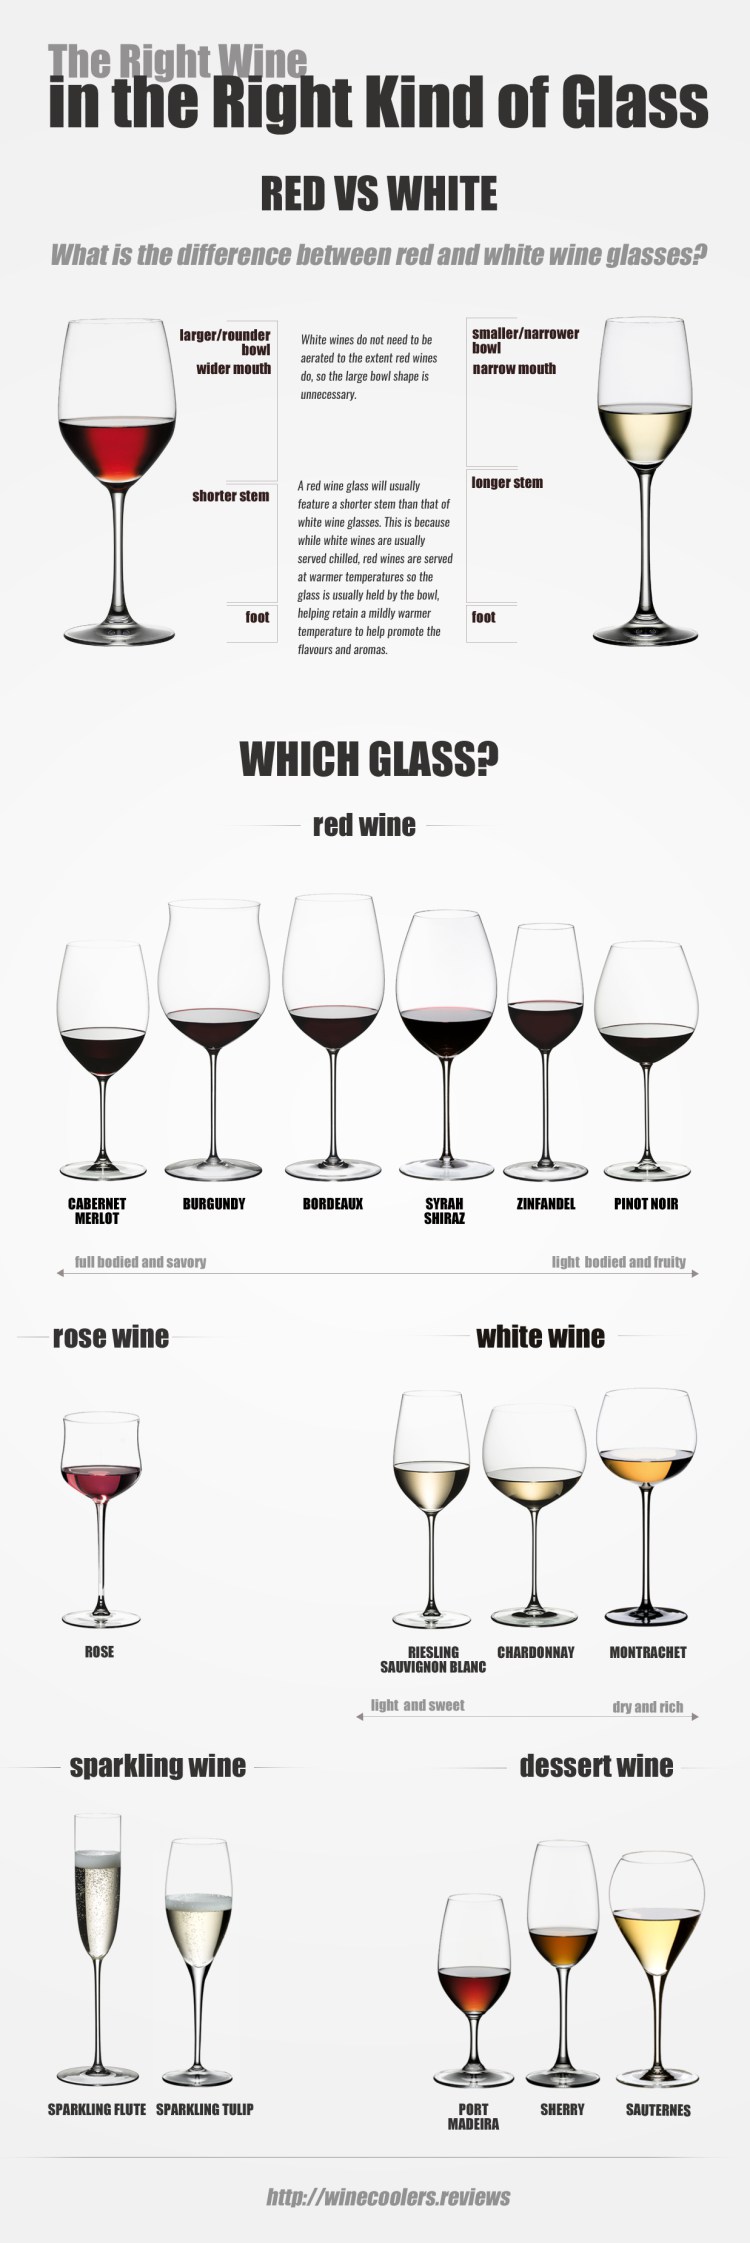
Just like how specific wines bring out the best flavors in certain foods, specific wine glasses bring out the best characteristics of each wine. The Right Wine in the Right Kind of Glass infographic from Wine Coolers starts off by showing us some general characteristic differences between red and white wine glasses, then shows us the correct wine glass to pair with each wine.

Have you ever wondered why there are different kinds of wine glasses? This article will illuminate the reason for different sizes and differently shaped wine glasses and help you smell the rich aroma of the right kind of wine enjoyed out of the right kind of glass for that wine.

Each type of wine has its own characteristics that stimulate the senses. These characteristics differentiate them from other wines. Every wine should be served in the most appropriate wine glass that will effectively enhance our reception of its unique characteristics.

Wine glasses come in a variety of shapes, and like wines, they too have different characteristics or features that make them different. Some wine glasses are made specifically for wines that come from specific types of grapes, or from certain regions. A wine glass’ shape is designed to bring out the best in the wine that it’s made for. So certain wine glasses can really affect the flavor of specific kinds of wines.

You can read more details about which wine to pair with each glass at http://winecoolers.reviews.

Thanks to Kathrin for sending in the link!

Friday
Jun272014

The Basic Wine Guide

Basic Wine Guide infographic

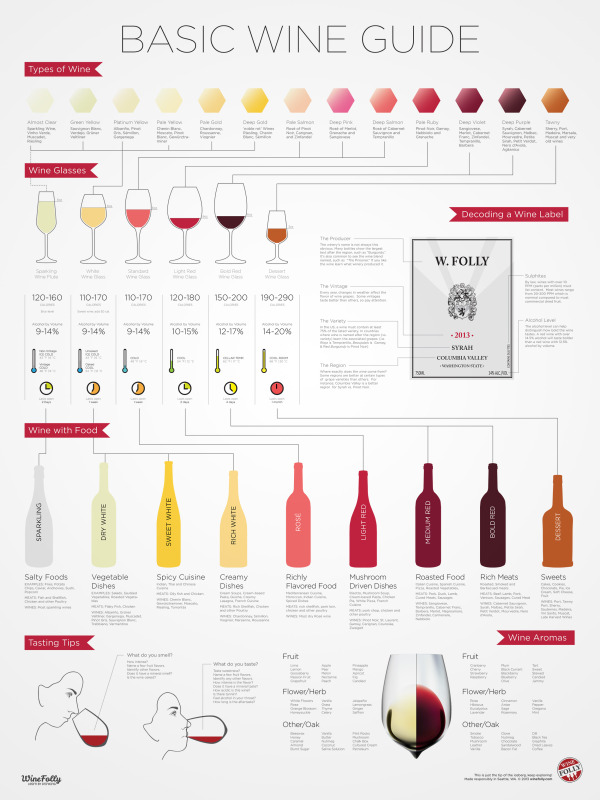
The Basic Wine Guide infographic from Wine Folly is full of the helpful tips one needs when trying to understand wine etiquette. This infographic has tips about what glass each wine should be in, what the wine should be eaten with, some tasting tips, and other things.

The infographic is now available for purchase as a poster for $24.

Wine is more than just a drink; it’s a lifestyle, a survey into history, a gastronomic adventure, a study in farming and a way to explore different cultures. But with so many different angles to approach wine, how do you get started?

Fortunately, there are only a few basic techniques to learn as well as some common wine knowledge. With a little practice you will be over the hump of being a rudimentary wine ‘dabbler’ to becoming an upstanding wino, capable of ordering wine like a pro.

The wine for beginners infographic has the answers to your questions. Learn the different wine styles, wine glasses and tips on tasting like a wine connoisseur.

This design keeps the types of wine in the same order all the way down the infographic, creating a nice and tidy visual for anyone who is looking for specific information on the infographic.

Found on winefolly.com

Tuesday
Feb182014

Food & Wine Pairing Method

Food & Wine Pairing Method infographic poster

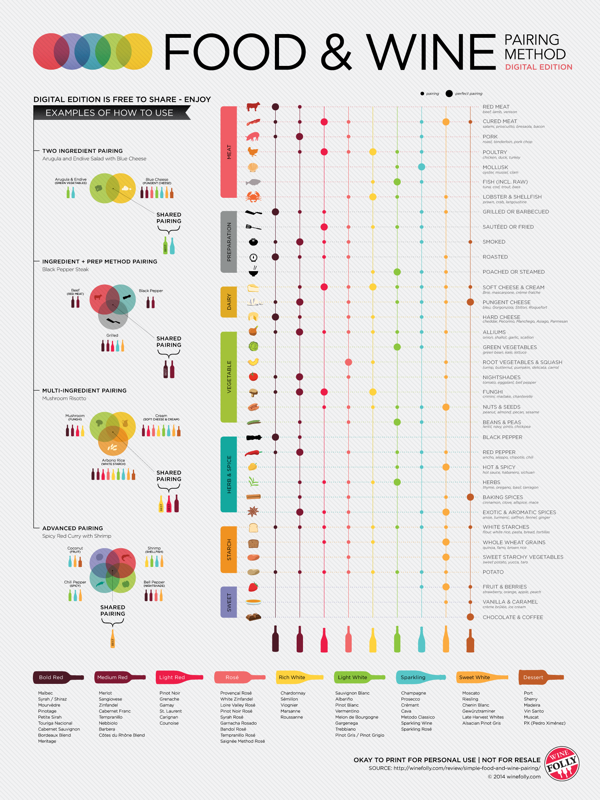
A great infographic for National Drink Wine Day (February 18), the Food & Wine Pairing Method is a new poster from Wine Folly that shows all of the compatible and Best wine matches for different foods and preparation methods.

See the theory of food and wine pairing in action with this easy to use chart. Then, understand the simple science behind food and wine pairing based on our basic sense of taste.

You can learn the fundamentals of how taste components like sweet, sour, spice, bitter and fat go together. Then, try pairing wine by letting the characteristics of your food suggest your wine.

Available for purchase for $24, it’s also available as a high-resolution download so you can print out your own personal poster.

The design is very clean and colorful.  The circles in the table only have two different sizes, small and larger.  There can be many small circles to show all of the compatible wines, but only one “Best” match shown with the large circle.  The multi-ingredient direction down the left side are easy to understand, but it is still a little difficult for readers to visually compare rows that are not adjacent, and far apart.

Friday
Mar292013

Wine Pairing - Inspired Infographic Advertising

Wine Pairing - Inspired Infographic Advertising

How to Pair Wine with the Bright, Bold flavors of Southeast Asia is a new infographic from P.F. Changs’s, an upscale restaurant chain, as part of the content in their “Inspired” advertising campaign.

The flavors of Southeast Asia cuisine are exploding in popularity.  Venture below to learn about the region’s most delicious ingredients and the dishes they can create.  Find out how to pair each dish with the perfect wine to enhance those flavors.

I love seeing an infographic design being used in this fashion, as part of a larger content marketing strategy.  The larger advertising campaign also includes specifically, interactive PDFs and a dedicated page on their site to entire program.

Although wine pairing infographics are not new, P.F.Chang’s made this custom to coincide with their own menu.  So this design is meant to help diners match wine types specifically to items on the menu at P.F. Chang’s.  The color coding ties the ingredients in to the different dishes and types of wine.

Thanks to Anne for sending in the link!

Tuesday
Mar052013

Pairing Wine & Food

Pairing Wine & Food infographic poster

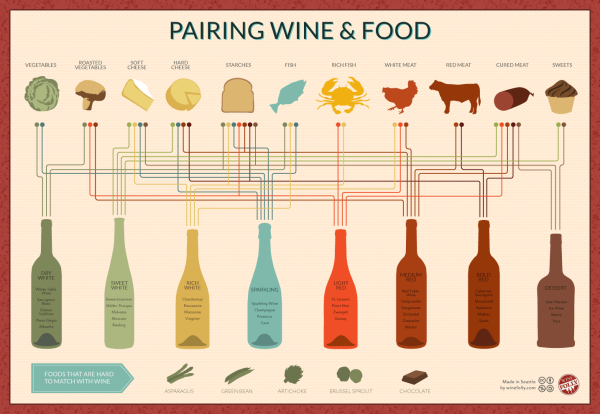
Pairing Wine & Food from Wine Folly is a simple, but incredibly useful infographic design.

Ever sink your teeth into a maple bar donut and follow it with a sip of straight black coffee? If you haven’t, you need to. The sweet and fat of a donut is the perfect compliment to bitter hot coffee. You’ll never want to add milk and sugar again.
 
Sommeliers use opposing taste profiles such as sweet and sour all the time to create perfect food and wine pairings. Follow the simple set of guidelines below to make the best wine and food pairings at home.

This is the kind of infographic design you just want to hang up in your kitchen, because you’ll be looking at it so often.  This design is deceptively simple.  The color-coded connection lines are easy to follow, and it’s clear to the reader that they have good choices to drink with different foods.  There isn’t one “right” answer.

Also available as a poster: http://shop.winefolly.com/collections/posters/products/basic-food-wine-pairing

Found on Infographics Showcase and  Best Infographics

Friday
Sep142012

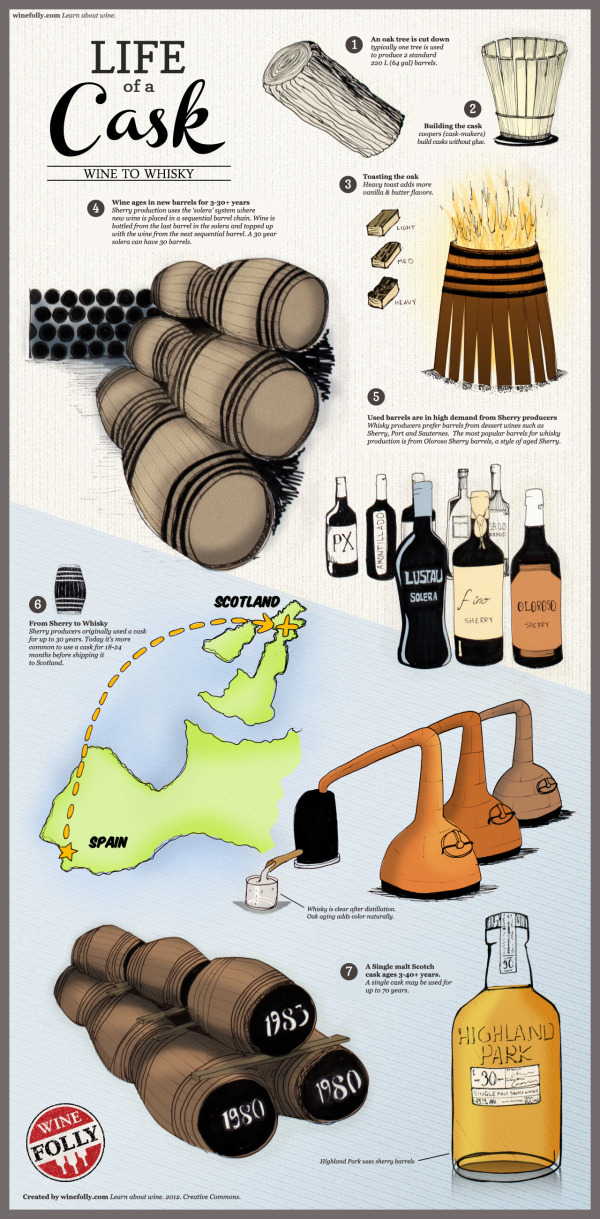
Life of a Cask: Wine to Whiskey

 Life of a Cask: Wine to Whiskey infographic

Wow! Who knew that the Cask would be so valuable! It is a key ingredient to making our favorite wine and whiskeys! See how Scotch depends on Sherry in the infographic Life of a Cask: Wine to Whiskey from winefolly.com.

An infographic on the life of a cask, from wine to whiskey. Find out where casks start their life and see how Scotch is dependent on Sherry.

Cask Facts

  • Used wine barrels are in high demand for Scotch and whisky production.
  • Distilleries prefer Oloroso Sherry casks and other dessert wine casks such as Port and Sauternes for aging whisky.
  • Sherry producers use larger casks called Hogheads (250 L) and Butts (500 L).
  • Some distilleries own forests in America where they source quercus alba (white oak) to produce casks.
  • Distilleries often loan unused casks to Sherry producers to ‘season’ them.
A Single malt Scotch cask ages 3-40+ years. A single cask may be used for up to 70 years

Nice visual explanation.  Easy to follow with a focused message that isn’t crowded with a bunch of additional factoids.  

The text is a little too small to read without zooming in closer, and there should be a URL at the bottom linking back to the original infographic landing page.  Otherwise, how can people find the original version they can read when a blog doesn’t link back correctly?

Just in time for the weekend too, it’s making my thirsty…

Thanks to Justin for sending in the link!

Friday
Apr152011

Client Infographics: Wine iPhone Apps


Two infographics InfoNewt (my company) designed recently for the great folks at VinTank.com, a think tank for the wine industry.  Are There Any Good Wine Apps for the iPhone? summarizes the highlights of the data that VinTank gathered from the iTunes Store.  Sorting through 452 wine apps is a lot for a consumer to figure out (intimidating!), so they broke them up by price, rating, business model and type of app.

We took it upon ourselves to evaluate all 452 wine related application available for the iPhone. That is more than six times the amount of wine related applications that was available on our last iPhone Report over a year ago. Each application went through an expansive 20-point inspection that surfaced strengths and weaknesses of their model, UEX, innovation, consumer value, winery value and much more.

You will also notice that we chose do a visual representation of all the data collected, because let’s face it, not only is our attention spans less with amount of content that requires our attention but also because infographics are pretty cool and definitely the trend to display deep rich amounts of numbers, information and data!

The second infographic displays the Top 26 Most Promising Wine Apps, as judged by VinTank.  These are grouped by type of app, and if you view the larger version you can click on any of the icons to be taken to the iTunes page to learn more about the app.
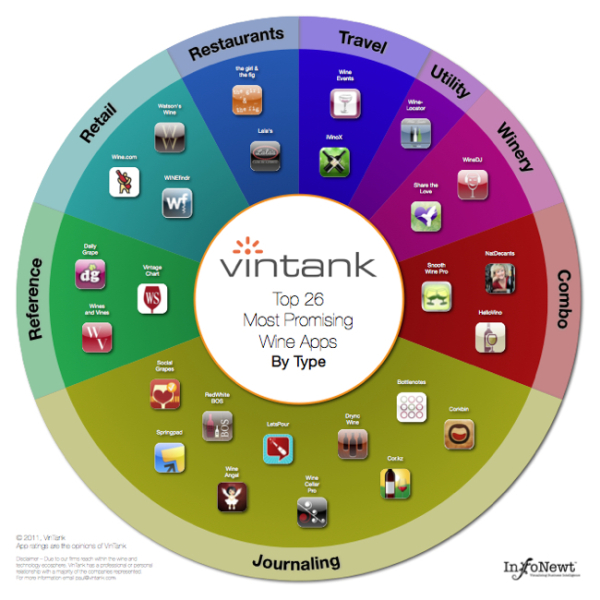
The team at VinTank obviously put a ton of effort into gathering data and evaluating all 452 apps so they could share this information with the public. 

After all that analysis it was clear to us that there were definitely leaders in the mobile space that showed the most promise. It is important to note that some of due to our deep reach within the wine and technology ecosphere, we have professional or personal relationships with a majority of the Top 26 that have been outlined. This however, does not change our view about how exciting it will be to see how all of them continue to improve their platforms and in fact, we excluded many other app companies that we also work with.

The Top 26 spectrum chart is an interactive version where you can learn more about each application and download their app directly should you choose to do so, or if you don’t already have it. Go ahead give it a try!

Even for data very limited to a specific target audience, an infographic is a fantastic tool to make the information interesting and easy to comprehend by the readers. 

Thanks to Paul and Evan for being great to work with.

Friday
May212010

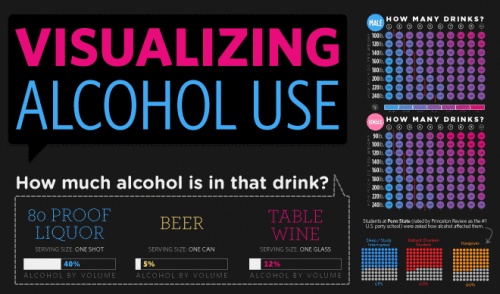
Visualizing Alcohol Use

From phlebotomist.net (a website all about blood!), the highly-colorful Visualizing Alcohol Use infographic explores the effect of alcohol 

How much alcohol can your bloodstream handle? Take a look at the graphic to check out everything from blood alcohol averages to the highest blood alcohol content ever survived (you won’t want to try this at home).

There’s no designer credited, but if this wasn’t designed by EJ Fox (@pseudoplacebo) then it was heavily influenced by his work.

Thanks to Cate for the link!

Monday
Aug102009

What is Your Wine Personality?


From the Texas Department of Agriculture at GoTexanWine.org, the Wine Personality Wheel comes from the Texas in a Bottle guide to Texas Wine (download as a pdf).  I love the sense of humor.
Ever listen to somebody describe a wine?  They talk about it having "character" and "personality."  To hear them tell it, wines are a lot like people.  We've talked it over and came to a conclusion - they have it backwards.  People are a lot like wines.
Here at the Viticultural Personality Institute, we've compiled a fun list of personality types based on wine preferences.
If your favorite wine listed here does not accurately reflect your particular personality, please choose another favorite wine (or change your personality - otherwise, you'll make our researchers look bad).

Looking around the GoTexanWine.org site, I also found a good, animated timeline (link) of the history of wine in Texas.


Eight federally approved Viticultural Areas currently exist in Texas. Eighty-five percent of wine from a Viticultural Area must be made from grapes grown within the area's boundaries. If the wine is a varietal, 75 percent of that wine must be made from the designated grape variety.