About
Randy Krum
President of InfoNewt.
Data Visualization and Infographic Design

Infographic Design

Infographics Design | Presentations
Consulting | Data Visualizations

DFW DataViz Meetup

Join the DFW Data Visualization and Infographics Meetup Group if you're in the Dallas/Fort Worth area!

Search the Cool Infographics site

Custom Search

Subscriptions:


Feedburner

The Cool Infographics® Gallery:

How to add the
Cool Infographics button to your:

Cool Infographics iOS icon

- iPhone
- iPad
- iPod Touch


Read on Flipboard for iPad and iPhone

Featured in the Tech & Science category

Flipboard icon

Twitter Feed
From the Bookstore

Caffeine Poster

The Caffeine Poster infographic

« Seasonal Visual Timelines | Main | Where your Apple Tax goes... »
Tuesday
Nov042008

Create Your Own Electoral Map


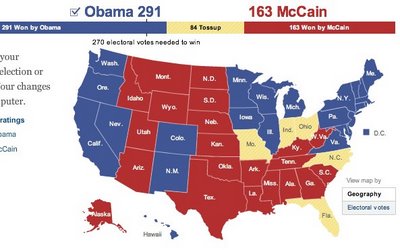
Since today is Election Day, the nytimes.com has a neat feature that lets you create your own Electoral Map.  Ireally like that it also gives you the option (seen above) to view the country with teh states sized by electoral votes or by geography (below).


It's been preloaded with the NYTimes.com breakdown of how the states may fall today, and which states are still undecided.  It's a little misleading because there are more undecided states, but they have assumed they will lean as the have historically.  It also allows you to change them on your own so you can see the effect on the overall election.

When your done playing, you can also see the NYTimes version of the map that includes the states that are leaning, but are not yet truly decided.


As you can see, the NYTimes.com site is predicting a Democratic win.  Let's see what really happens today.

PrintView Printer Friendly Version

EmailEmail Article to Friend

Reader Comments

There are no comments for this journal entry. To create a new comment, use the form below.
Editor Permission Required
While we are migrating to a new site design, you must have editing permission for this entry in order to post comments.