About
Randy Krum
President of InfoNewt.
Data Visualization and Infographic Design

Infographic Design

Infographics Design | Presentations
Consulting | Data Visualizations

DFW DataViz Meetup

Join the DFW Data Visualization and Infographics Meetup Group if you're in the Dallas/Fort Worth area!

Search the Cool Infographics site

Custom Search

Subscriptions:


Feedburner

The Cool Infographics® Gallery:

How to add the
Cool Infographics button to your:

Cool Infographics iOS icon

- iPhone
- iPad
- iPod Touch


Read on Flipboard for iPad and iPhone

Featured in the Tech & Science category

Flipboard icon

Twitter Feed
From the Bookstore

Caffeine Poster

The Caffeine Poster infographic

Entries in diagrams (4)

Friday
Jan192018

Ikigai - Visualizing the Japanese Concept of Life's Purpose


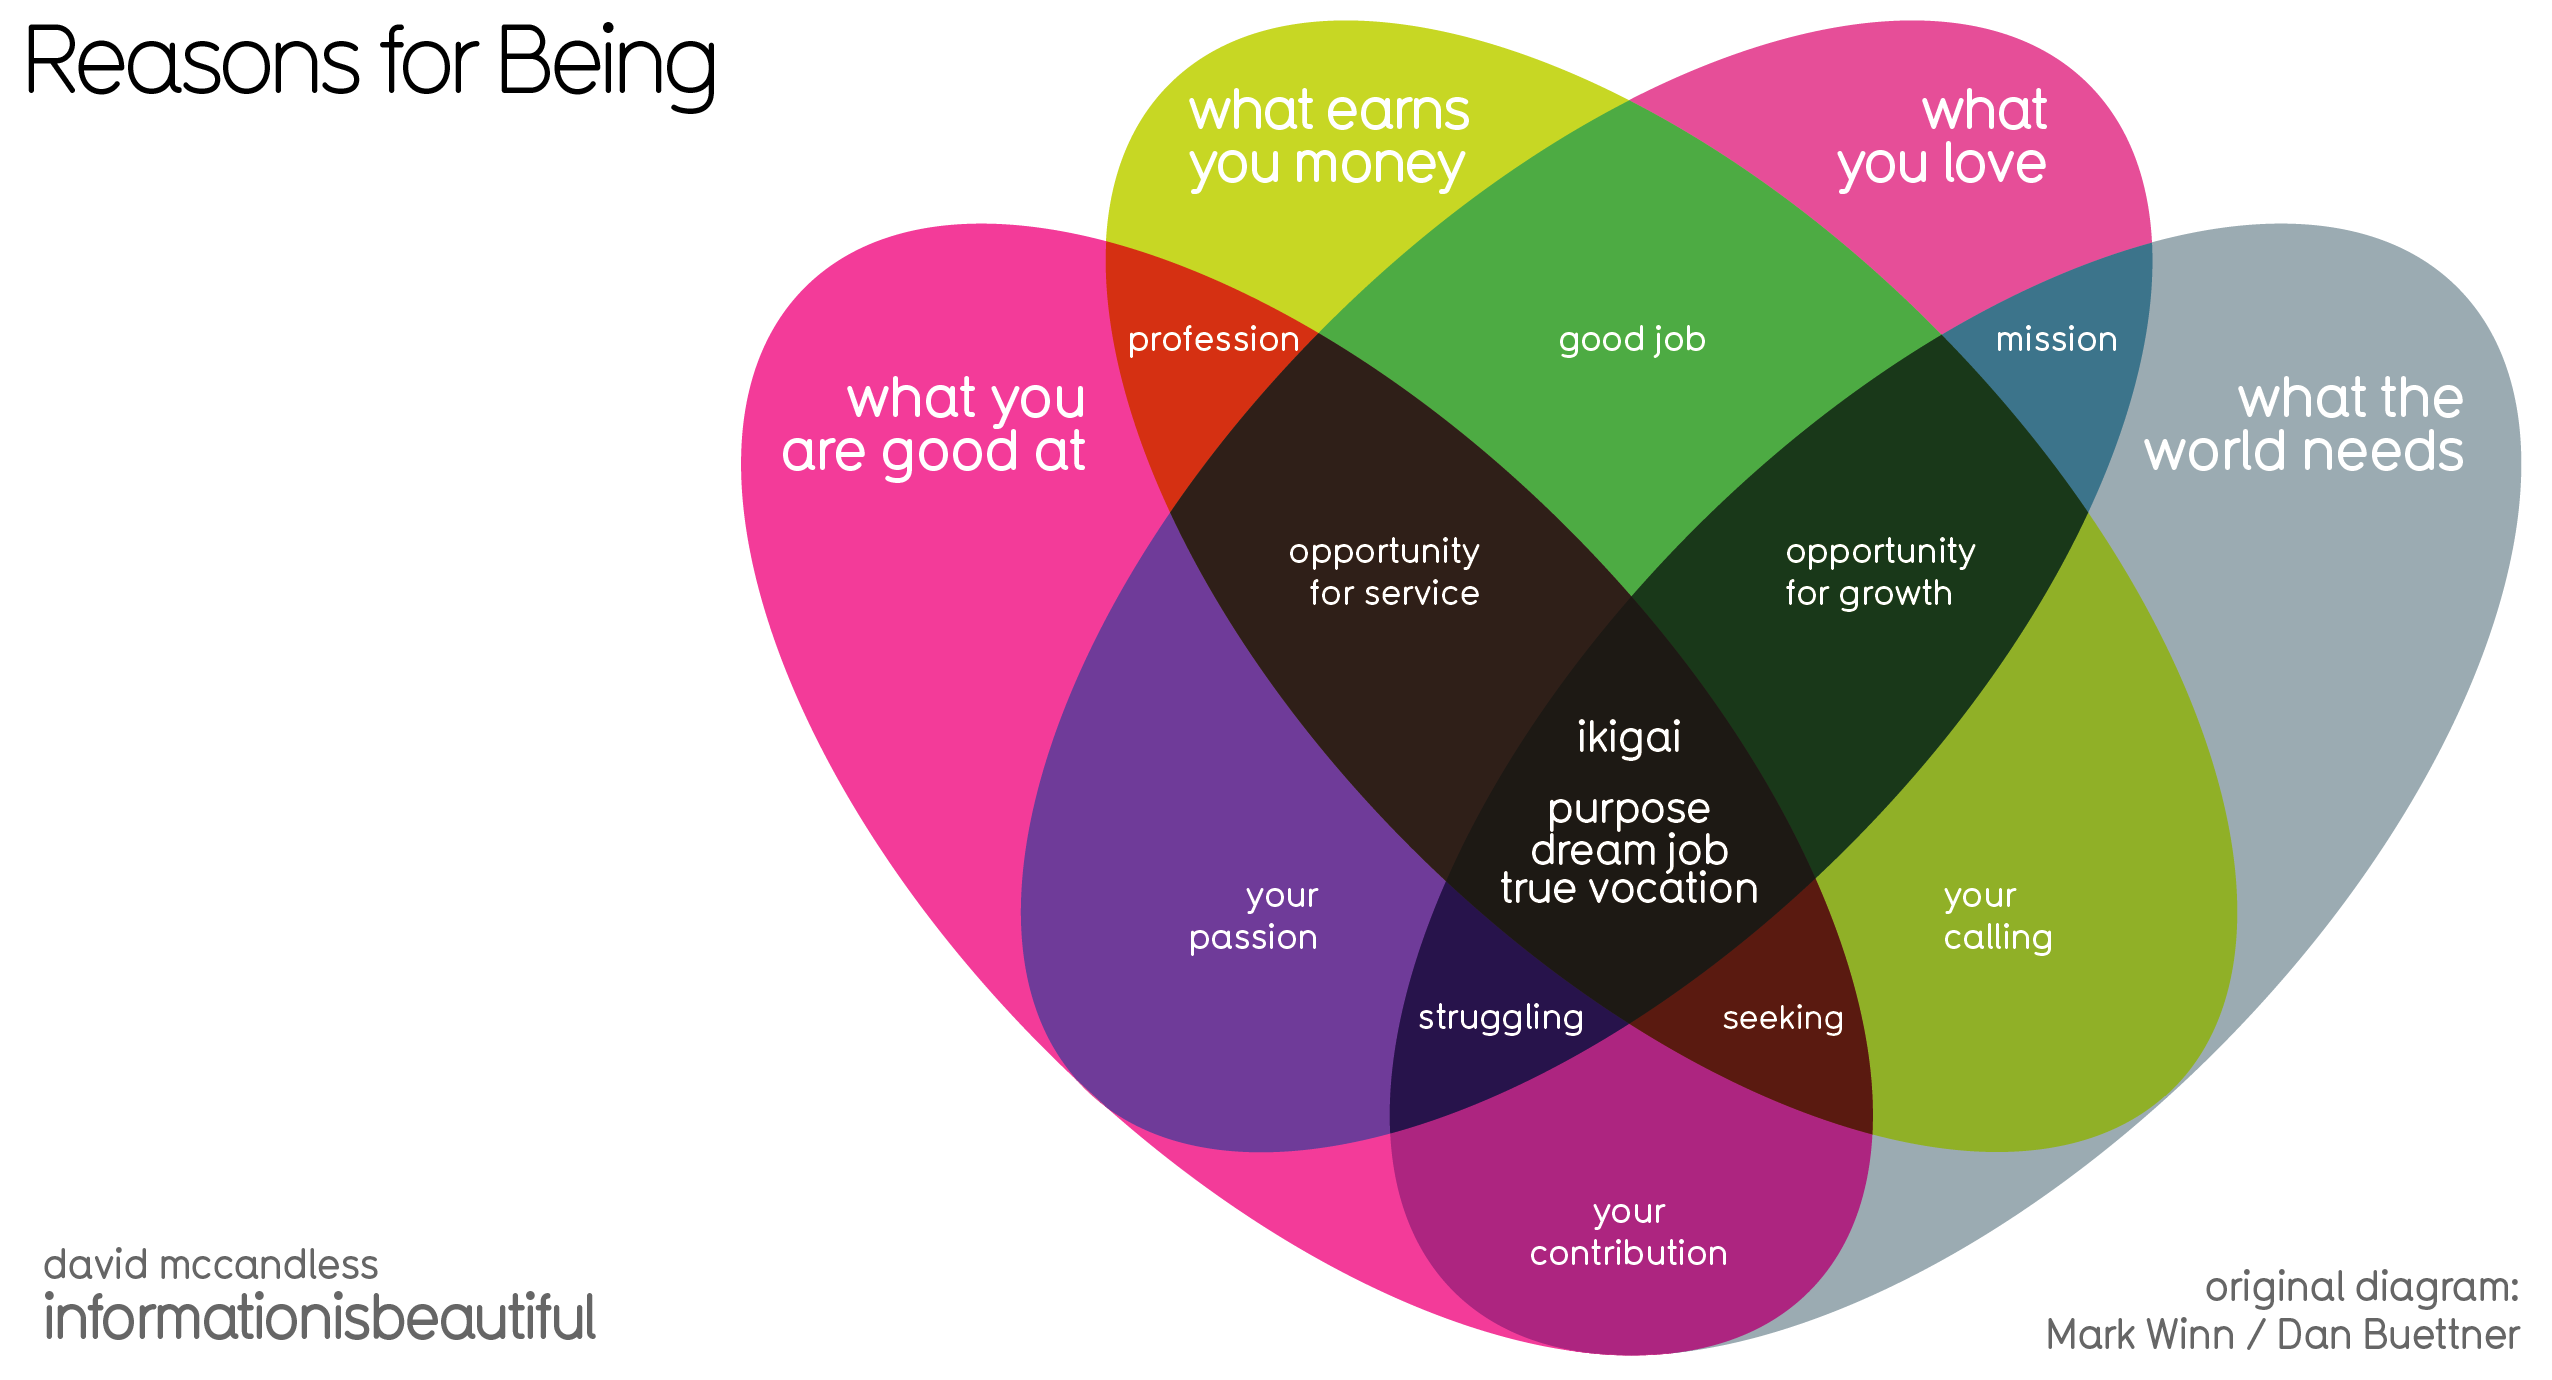
Ikigai is a Japanese concept that explains how a person can enjoy life. To illustrate this concept, a 4-sided Venn diagram was created by Dan Buettner (below), showing what it takes for one to discover their own. However, David Mccandless saw the original diagram and found it flawed. Above, we have his version of Ikigai- Japanese concept to enchance work, life & sense of worth diagram where he has theorized what should be inserted in the missing gaps, as well as giving the sections different sizes to more accurately represent the importance of each.

Ikigai is an interesting self-development concept from Japan, a prism for potentially seeing how to bring satisfaction, happiness & meaning to life. The direct translation is the “happiness of being busy.”

The original diagram was created by British community activist Marc Winn in 2014 from a TED Talk on Longevity by writer Dan Buettner.
 

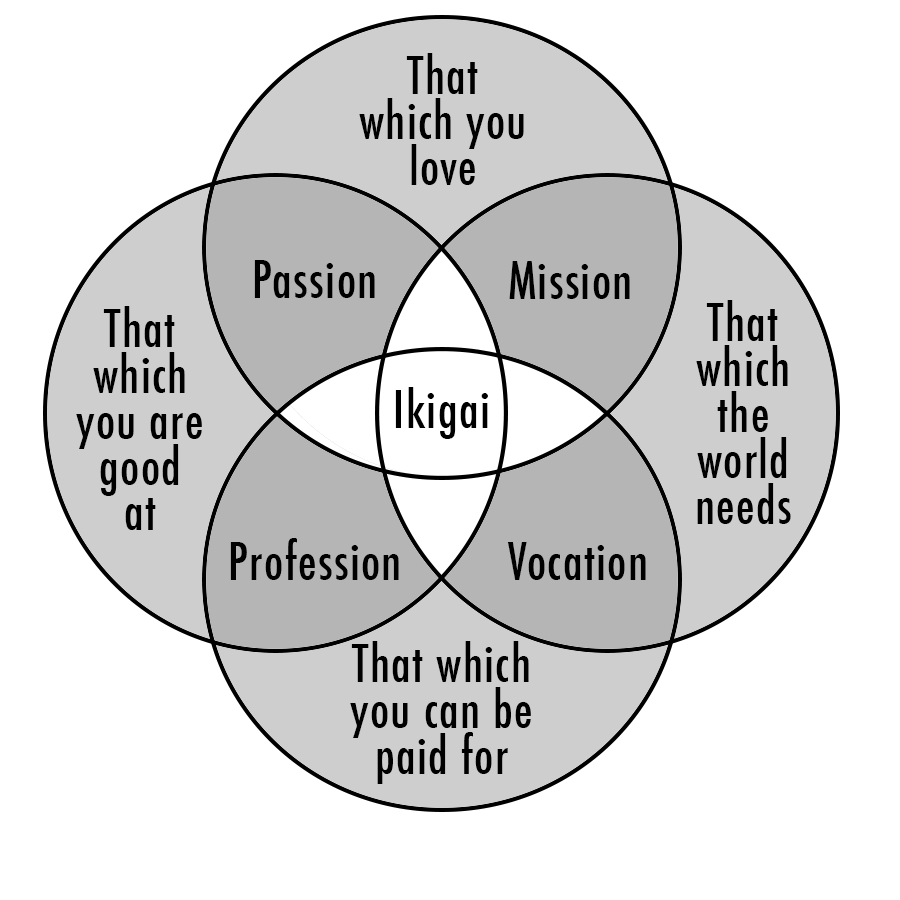
Sadly, pedantically, the four-way Venn in the diagram is broken, from a technical POV. If you look closely, two sectors – love & paid for, good at & world needs – don’t intersect uniquely.

So I fixed that and theorised what those missing sectors might contain, while making a few other tweaks.

Got stuck a bit with “what the world needs” category which has a touch of entrepreneurial zeal about it. Not everyone can impact ‘the world’. But couldn’t come up with a variation that worked.

What’s interesting is that two intersections make something positive – passion, mission etc. But three intersections create a discomforting pinch point i.e. if you good at something, it’s what you love and what the world needs, but doesn’t earn you money, you’re “struggling”.


Found on Information is Beautiful

Tuesday
Sep012015

How to Think Visually

How to Think Visually Using Visual Analogies infographic

How to Think Visually Using Visual Analogies infographic from Anna Vital gives a great variety of examples for anyone to use when you create your own graphics. It begins with the most recognizable visuals, circle graphs and diagrams. Further down are abstract analogies. They are reminiscent of physical objects, but they are simplified and abstract. Next, we have regular analogies that look like the physical objects you are familiar with. The final category are allegories. These are stories, or a series of analogies. The key is that these stories are familiar enough that we don’t have to retell them, but we should analogize every part of them.

Most research in cognitive science explores how we see things but little research is done on how we understand what we see.

Understanding is the ultimate test of how good your visualization is. So how can you make people understand? Show something familiar and analogize. If you know nothing else about visualization but pick the right analogy you are more than half way there. This is what a professional designer does - and there is no substitute for analogies.

How do you choose the right analogy? In this grid I organized analogies from the abstract down to the more detailed. I grouped them by similarity in shape. The goal is to enable you to quickly see the possibilities and “try them on” your information. With time you’ll be able to do all of this in your head. But for now this is a shortcut. 

As part of the infographic landing page, Anna has included a text description of each visual analogy. For the story on each graphic, read more at anna.vc

Thanks to @DR4WARD for sharing on Twitter!

Monday
Aug242015

The Spectrum of User Experience Design

The Spectrum of User Experience Design

The Spectrum of User Experience Venn Diagram came up again recently in a discussion with a client, and looking back I realized I had never posted it here on Cool Infographics. Designed in 2009 by Oliver Reichenstein at iA (Information Architects), this is one of those everlasting designs that is even more relevant and popular today than when it was designed.

Oliver posted about it's origins here

Can’t we just all get along? Or leave each other alone? We can’t. The product, the interface and the communication build on the tension between the economic, the technological and the design force.

The business department and the engineers need to agree on a product definition that guarantees high performance; engineers and designers need to work together to make the interface as simple as possible; and designers need to team up with the business folks to get the communication consistent.

Six years later and I still love it!

Wednesday
Nov272013

Thanksgiving Table Setting Diagrams

Thanksgiving Table Setting Diagrams

Just in case anyone needs a visual reminder when setting the Thanksgiving dinner table, the Table Setting Diagrams from Dinner-Party-Menu-Ideas.com make it super easy!  More of a diagram than an infographic, it’s still a super-useful visual!

Found on lifehacker, Brunch at Saks, and Apartment Therapy

Here’s a more detailed and further designed Thanksgiving Etiquette Table Setting Guide infographic from Adirondack Authority:

Thanksgiving Etiquette Table Setting Guide infographic

Found on Fine Dining Lovers

Both of these designs have an excellent Online Lifespan.  These designs are not new, they were originally published in years past.  The information presented is long-lasting, and will be relevant to readers every year for many years to come.