About
Randy Krum
President of InfoNewt.
Data Visualization and Infographic Design

Infographic Design

Infographics Design | Presentations
Consulting | Data Visualizations

DFW DataViz Meetup

Join the DFW Data Visualization and Infographics Meetup Group if you're in the Dallas/Fort Worth area!

Search the Cool Infographics site

Custom Search

Subscriptions:


Feedburner

The Cool Infographics® Gallery:

How to add the
Cool Infographics button to your:

Cool Infographics iOS icon

- iPhone
- iPad
- iPod Touch


Read on Flipboard for iPad and iPhone

Featured in the Tech & Science category

Flipboard icon

Twitter Feed
From the Bookstore

Caffeine Poster

The Caffeine Poster infographic

Entries in author (3)

Thursday
Jul132017

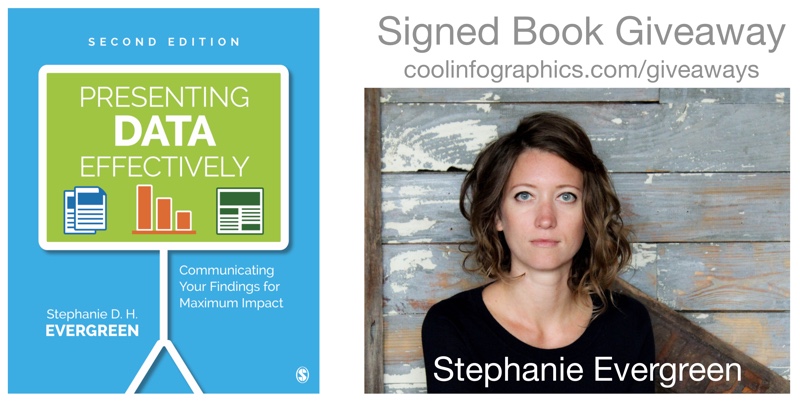
Presenting Data Effectively by Stephanie Evergreen!

Presenting Data Effectively Stephanie Evergreen 2nd Edition Interview and Giveaway

The updated 2nd Edition of Presenting Data Effectively by Dr. Stephanie Evergreen was just released! This is a fabulous resource, and the new edition includes full color images and screenshots as well as new content!

During JULY 2017, I am giving away one signed copy of Presenting Data Effectively! Register on the Giveaways Page by July 31st to be entered.

Now in striking full color, Presenting Data Effectively, Second Edition by Stephanie D. H. Evergreen shows readers how to make the research results presented in reports, slideshows, dashboards, posters, and data visualizations more interesting, engaging, and impactful. The book guides students, researchers, evaluators, and non-profit workers—anyone reporting data to an outside audience—through design choices in four primary areas: graphics, text, color, and arrangement. The Second Edition features an improved layout with larger screenshots, a review of the recent literature on data visualization, and input from a panel of graphic design experts.

Stephanie was very helpful and answered a bunch of questions I sent her about visualizing data and the updated book:

Who is the book intended for?

Stephanie Evergreen: Anyone who has to convey some information to other people should read this book, whether it is in a report, a slideshow, a dashboard, etc.


It’s been 4 years since the 1st edition. What has changed the most?

Stephanie Evergreen: Color! We are finally catching up with the modern world and printing in full color. And speaking of catching up, I’ve included a lot of new content about how we have to change how we report to adapt to a mobile reading culture.


What does it mean to present data effectively?

Stephanie Evergreen: At the very core, that means people understand what we are trying to say. Which means we will have to adjust how we talk about our work so it aligns with how humans come to understand things. So with a little bit of the research behind how brains work, we end up with many significant implications for how we report.


What makes presenting data effectively so challenging?

Stephanie Evergreen: The hardest part is uprooting the ways we have been taught to present, usually from academia. You know what I mean. Lots of bullet points. Dense slides. Too much detail. We think we have to come off this way because it will show we are studious, thorough, and very smart. But reality is that it will only confuse our audiences. And if we are confusing our audiences, we aren’t doing our job. It actually takes in-depth knowledge about a topic to be able to convey it to others with clarity.


What should readers expect to learn and apply to their own presentations?

Stephanie Evergreen: Readers will learn extremely practical guidelines to apply AND the buttons to push to make it happen, right inside the software we all already own.


Is there an ideal balance of text and visuals on a presentation slide?

Stephanie Evergreen: Slides are intended to be a visual support for our talk. So the ideal balance is enough text to frame your key point and a visual that provides the evidence or context for that key point.


How do you help people that are told to only use the company’s colors, fonts and presentation templates?

Stephanie Evergreen: Use them very well. And look for the places where the style guide *doesn’t* dictate your choices – such a font size – and do your magic in those gaps.


What are your thoughts on animated slide transitions and/or clicking to reveal different pieces of information on a slide.

Stephanie Evergreen: Please no transitions. The last thing you want is people thinking “oooh look at how her slide swept away like an ocean tide” because while they are thinking that, they’ve missed everything you were saying. Animating is a different story. Animation can be helpful to break down complex stuff and make it easier to digest. Just don’t be obnoxious (Swivel In, I’m talking about you).


How difficult is it to choose the right chart style?

Stephanie Evergreen: We have a lot of choices, so it can be difficult to even know where to begin. But if you start with your point – the thing you are actually trying to say with this data – you’re headed in the right direction. And coming up with your point, as in really doing the thinking and the analysis, is the hard part.


Is complexity the enemy of good data visualization design?

Stephanie Evergreen: Heck no! Clutter is the enemy of good data visualization design. Complex stuff can be clear and easy if we strip out all the junk.


How do you make it look so easy?

Stephanie Evergreen: I’m funny.


Is there a website to go along with the book?

Stephanie Evergreen: My website rocks. http://stephanieevergreen.com/ My blog is full of tons of resources and I put out new posts every other week that show you exactly how to do what I do. Books are awesome but they take 6 months to print and in that time, I’ve already had a dozen new ideas and the blog is where you’ll find them.


Are you speaking at any upcoming presentations or webinars?

Stephanie Evergreen: I’m on the road, criss-crossing the globe, working with truly awesome folks, giving keynotes and workshops about 35% of my life (typing on a plane right now). Check out my events here: http://stephanieevergreen.com/upcoming-events/ and come say hi or bring me in yourself.


Where’s the best place to follow you online?

Stephanie Evergreen: Dataviz nerds hang out on Twitter, so catch me there https://twitter.com/evergreendata . You can also follow my travel adventures on Instagram at: https://www.instagram.com/severgreen/

Friday
Jun232017

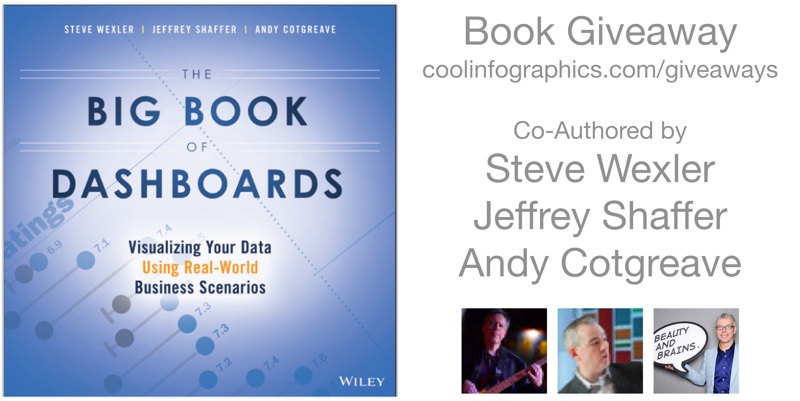
The Big Book of Dashboards!

The Big Book of Dashboards is a fantastic new book release in 2017 co-authored by Steve Wexler, Jeffrey Shaffer, and Andy Cotgreave. Published by Wiley, the book is available in print and ebook. You can check it out here on Amazon!

The book starts with good data visualization design practices and then dives into 28 case studies of real dashboard designs in practice. The case studies are design tool agnostic, covering good dashboard designs from a variety of design tools. It doesn't matter what software you use, you will find inspiration and great examples in this book!

I met the co-authors at this year's Tapestry Conference, and interviewed them about the book below.

This month (June 2017) I'm giving away one copy to a lucky winner!  Register on the Giveaways Page by June 30th to be entered.


Who is the book intended for?

Steve Wexler: Anyone tasked with building or overseeing the development of business dashboards.


The three of you are in distant locations from each other. What was your process to collaborate on writing the book?

Steve Wexler: It wasn’t just the three of us!  While we were the authors, the book has 17 contributors and we would have web-sharing sessions with all of them so we could understand the rationale behind the dashboards.  There were also many cases where we would ask them to either defend their decisions or make some refinements.

In any case, we web-conferenced and relied very heavily on Slack to handle asynchronous collaboration.  The slack channels are massive (you should see all the discussions on the definition of the dashboard).

Andy Cotgreave: We also used Join Me for teleconferencing and Dropbox for file sharing. Looking back, it’s incredible how technology facilitates close collaboration across the world. 


How do you define what is a dashboard?

Steve Wexler: A dashboard is a visual display of data used to monitor conditions and / or facilitate understanding. Yes, it’s a broad definition.

Jeff Shaffer: There were long discussions on this one. We really considered Stephen Few’s definition, but picked apart terms like “single screen” and “monitored at a glance”. For example, does printing a dashboard and taking it into a meeting disqualify it from being called a “dashboard”? We think it’s still a dashboard and while it may not be used to monitor something in that instance, it does facilitate understanding. Another example is a “dashboard” that is presented on a tablet or phone where scrolling off a single screen is necessary. Technology, and screen size, is constantly changing, so while our definition is broad, I find it more accurate.


Why should dashboards be elegant or visually appealing?

Steve Wexler: I guess for the same reason that your want a computer, phone, appliance, etc., to be elegant or visually appealing.  For certain, the dashboard must first be functional (i.e., inform, enlighten, and engage) but the “engage” part is more likely if the experience with the dashboard is pleasant.

Andy Cotgreave: You need people to engage with a dashboard. Don Norman defines success according to three levels of processing: Visceral, Behavioural and Reflective. Each needs to succeed. The first response is Visceral - it’s an instant emotional reaction to whether you like something. It takes little effort to ensure the colours, fonts, layout of a dashboard is appealing, but it’s vital to get that visceral response right. The “functional” part comes next, in the behavioural level.


Do dashboards have a size limit? How large can they go?

Steve Wexler: They should be bigger than a bread box and smaller than the Empire State Building. Goodness, it depends on so many things -- the audience, the platform (desktop vs. tablet vs. mobile) and so on.

Looking at the 28 scenarios in the book, with the exception of the Financial Times Economy at a Glance dashboard, none of the desktop-based dashboard have any scrolling (many of the mobile-dashboard do provide for scrolling).  

As for the number of distinct charts on a dashboard the examples run from as few as one to around a dozen.

Interestingly, two of the examples that have a dozen or so charts are from Dundas, but because they are elegant and visually appealing you don’t feel overwhelmed by them.

Andy Cotgreave: Traditionally I’d have said they should fit on a single screen. But as mobile takes over, I think that is changing. The Financial Time Economies at a Glance dashboard is very very tall and designed for scrolling. It works extremely well on mobile. A starting rule of thumb would be to try to keep everything on one page.


How do you address the challenge of choosing the right type of chart for a given data set?

Steve Wexler: That is the raison d'être for the book! Given a particular predicament / scenario, and given the data you have, what is the chart or combination of charts that shine the most, brightest light on the subject?  That’s what we’re trying to do.

And very often that chart or combination of charts may not be what you expect.  Andy wrote a terrific chapter on visualizing time and shows there are so many cases where you don’t want to use a line chart.

Jeff Shaffer: It all starts what you are trying to show with the data. Presenting time is a great example. We have an entire chapter devoted to the different ways to show time, i.e. data over time. Typically a line chart would be a great way to show trend over time, but there are many other ways to visualize time.


What are the key mistakes people make in their dashboards?

Steve Wexler: Too much clutter and not enough clarity.  Plus we’ll often see people putting too much emphasis on decoration and not enough on information.

Jeff Shaffer: The misuse of color. People using color incorrectly or in an overwhelming way. We talk in depth about this in the opening chapter and throughout the book in many of the examples.


What advice would you give young professionals just getting started with visualizing data?

Steve Wexler: Seek feedback when building dashboards.  You need to meet with your audience, often, to make sure what you’re building actually helps the intended audience. 


What’s available for readers on the bigbookofdashboards.com site?

Steve Wexler: There are links to articles, podcasts, and workshops.  We’re also posted downloadable versions of many of the dashboards featured on the book.


Where can people follow all of you online?

Jeff Shaffer -- @highvizability, www.dataplusscience.com
Andy Cotgreave -- @acotgreave, gravyanecdote.com
Steve Wexler, @vizbizwiz, www.datarevelations.com


Are there any events coming up related to the book?

 Steve and Jeff are offering a workshop in Atlanta on June 14  and will be offering more workshops throughout the year (See http://bigbookofdashboards.com/workshops.html)

Andy, Jeff, and Steve will be offering a free webinar on how to build world-class business dashboards on June 21.  (See https://www.tableau.com/learn/webinars/big-book-of-dashboards)

We will all be at the Tableau Conference in Las Vegas, presenting sessions, and signing books!


Friday
May272016

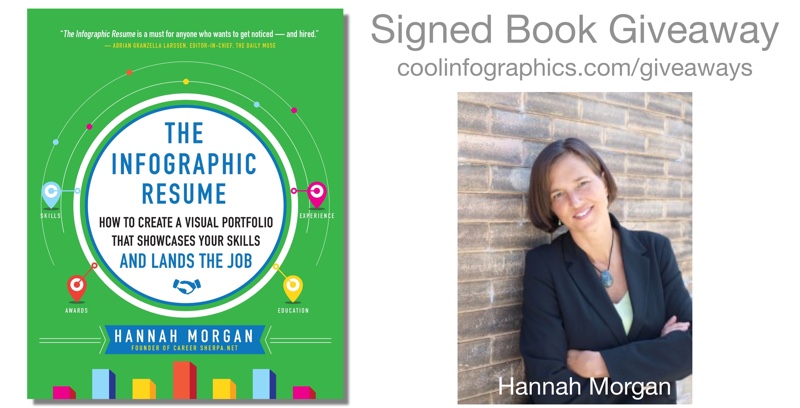
The Infographic Resume by Hannah Morgan: Interview & Giveaway

The Infographic Resume is a fabulous book by Hannah Morgan from Career Sherpa! I have a chapter dedicated to infographic resumes in my book, Cool Infographics, but this is the only entire book I've seen dedicated to infographic resumes anywhere. Find more on Hannah's book page.

This month I am giving away one signed copy of The Infographic Resume! Register on the Giveaways Page by June 30th to be entered.

Infographic resumes are in, and they’re not just for designers. Free online tools are popping up every day to help anyone create a dynamic, visual resume—adding panache without sacrificing substance for style.

The Infographic Resume provides essential tips and ideas for how to create visual resumes and portfolios that will make you stand out from the crowd. Richly illustrated in full color and including lots of inspiring examples, the book will teach you how to:

  • Create a powerful digital presence and develop the right digital content for your goals
  • Build your self-brand and manage your online reputation
  • Showcase your best work online
  • Grab a hiring manager’s attention in seconds

Packed with dynamic infographics, visual resumes, and other creative digital portfolios, The Infographic Resume reveals the most effective tools, eye-catching strategies, and best practices to position yourself for any job in any kind of business.

Everyone should follow Hannah Morgan on Twitter (@careersherpa)! She shares her wisdom and insights on resumes, hiring and career issues openly. You can download her Infographic Resume Cheat Sheet, and she maintains a Pinterest Board gallery of Infographic and Visual Resumes.


Hannah answered a handful of questions about The Infographic Resume:

How would you define an infographic resume?

Hannah: An infographic resume converts your work experience into visual pieces such as charts and graphs. Instead of finding the right words to write about your skills and achievements, you can present the most important parts of your experience visually. While this may sound difficult for some people, especially those without design skills, it can actually be liberating. As the saying goes, a picture is worth a thousand words.

Chapter 1 was great! Could you summarize your chapter on How We Got Where We Are Today?

Hannah: You may have noticed infographics and other visual elements appearing more often in newspapers, marketing materials and social media than in the past. We are inundated with information and rely on our smart phones for on-the-go access. Reading large blocks of text takes time and it is even more difficult to read on a mobile device. Studies indicate that the brain processes pictures faster than words. Other studies say pictures increase comprehension, increase the time people spend on a website, and increase sharing of updates on social media. Job seekers can leverage these trends to their advantage. Savvy job seekers know today’s job market is highly competitive. To make matters worse, almost every company has an Applicant Tracking System (ATS) which typically weeds out candidates and results in the dreaded “black hole” of no response. Technology has enabled job seekers to break out of the standard “apply online and wait” mold. By applying out-of-the-box marketing strategies such as social media campaigns, personal websites and infographic resumes, job seekers can do more to stand out and garner the attention they crave (and deserve). 

How would you describe the current state of the market for infographic resumes?

Hannah: Infographic resumes deviate from the expected and that is the very reason to use one. Most job seekers will not use one either because they don’t know about them, don’t know how to create on or think it would be risky to try and use one. In my opinion, the rewards outweigh the risk. Go ahead, use an infographic resume.

What are some of the more unexpected jobs or careers that you have seen candidates use an infographic resume?

Hannah: The early adopters of infographic resumes were people who had graphic design skills. But infographic resumes are being created by technical writers, sales representatives, information technology specialists and many other types of occupations. Infographic resumes demonstrate creativity and innovative thinking which are qualities valued in marketing departments, information technology, and start-up organizations, just to name a few. Consider the culture of the organization and the requirements of the role to help determine if an infographic resume might be successful opening doors.

Are there any risks associated with infographic resumes?

Hannah: There are some things you should know before you use an infographic resume. First, and foremost, do not use infographic resumes when submitting through applicant tracking systems! The technology used in ATSs cannot read visual content. You should also take into consideration who you are sending your infographic resume to. Typically, people in human resource and recruiting roles expect to see the traditional, conservative text resume. These roles often have to review hundreds, if not thousands, of resumes and do not have time to search your infographic for skills and work history. A better strategy is to send your infographic resume to the actual hiring manager or to a contact you have made inside the organization. Infographic resumes also make a great addition to your LinkedIn profile as embedded media in the summary section. If you have a personal website or online portfolio, an infographic resume works well there too. If you are proactively networking with people in your field of interest, bring your infographic resume to the meeting and share it to guide the conversation. And why not bring an infographic resume to an interview to impress the interviewers?

What types of reactions to infographic resumes are you hearing from hiring managers and recruiters?

Hannah:  About a year ago, I polled the recruiters, human resource professionals and career coaches in my network to get their feedback on infographic resumes and the overwhelming response was positive. In fact, 68 percent said they would look at an infographic resume, 32 percent said it would depend and no one said that they wouldn’t look at one. Here are some of the comments I received: 

“I would welcome a fresh, newer idea, which this is, as opposed to the same old resume.” -Hiring Manager

“Shows some creativity.”  -Other

“Yes! I would be thrilled with the creativity, and it would definitely be a resume that would stand out from the pack.” – Hiring Manager

“Yes, because normal resumes are boring.” -Other

Do you have your own infographic resume that I could share?

Hannah: Since I don’t have design skills, I rely on tools that convert my LinkedIn profile into an infographic resume, like this one created using vizualize.me. There are so many tools available to help create infographics so even people without design skills or familiarity with design software can dabble in infographics. I’ve written about four of those tools here: http://careersherpa.net/4-templates-for-infographic-resumes/


Hannah's Bio:

Hannah Morgan is the Founder, CareerSherpa.net and a Job Search Strategist. She is a speaker and author on  job search and social media strategies. She delivers fresh advice and serves as a guide to the treacherous terrain of today’s workplace landscape. Hannah’s experience in Human Resources, Outplacement Services, Workforce Development and Career Services equip her with a 360 degree perspective on job search topics. Recognized by media and career professionals, Hannah is an advocate who encourages job seekers to take control of their job search. Hannah is frequently quoted in local and national publications and she writes a weekly column for U.S. News & World Report.

Hannah is the author of “The Infographic Resume” (McGraw Hill Education, 2014) and co-author of “Social Networking for Business Success” (Learning Express, 2013). You can learn more about Hannah on CareerSherpa.net and by following her on Twitter at @careersherpa.