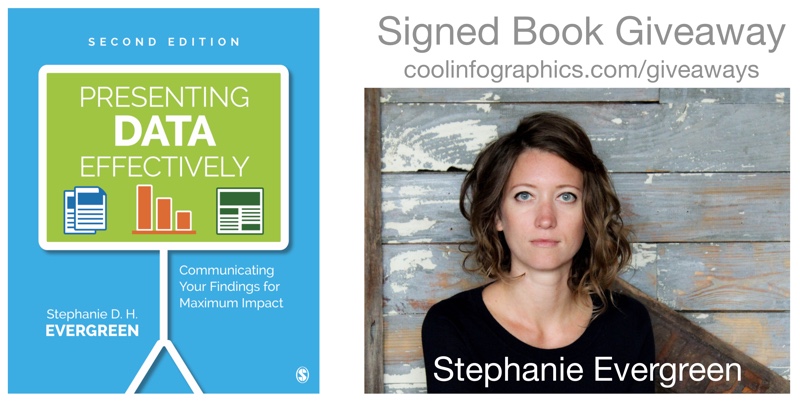
Presenting Data Effectively by Stephanie Evergreen!
The updated 2nd Edition of Presenting Data Effectively by Dr. Stephanie Evergreen was just released! This is a fabulous resource, and the new edition includes full color images and screenshots as well as new content!
During JULY 2017, I am giving away one signed copy of Presenting Data Effectively! Register on the Giveaways Page by July 31st to be entered.
Now in striking full color, Presenting Data Effectively, Second Edition by Stephanie D. H. Evergreen shows readers how to make the research results presented in reports, slideshows, dashboards, posters, and data visualizations more interesting, engaging, and impactful. The book guides students, researchers, evaluators, and non-profit workers—anyone reporting data to an outside audience—through design choices in four primary areas: graphics, text, color, and arrangement. The Second Edition features an improved layout with larger screenshots, a review of the recent literature on data visualization, and input from a panel of graphic design experts.
Stephanie was very helpful and answered a bunch of questions I sent her about visualizing data and the updated book:
Who is the book intended for?
Stephanie Evergreen: Anyone who has to convey some information to other people should read this book, whether it is in a report, a slideshow, a dashboard, etc.
It’s been 4 years since the 1st edition. What has changed the most?
Stephanie Evergreen: Color! We are finally catching up with the modern world and printing in full color. And speaking of catching up, I’ve included a lot of new content about how we have to change how we report to adapt to a mobile reading culture.
They're HEEEERRRREEEEEEEE!!! https://t.co/RKY9LZ9cGk pic.twitter.com/HzELPMcF1X
— Stephanie Evergreen (@evergreendata) June 2, 2017
What does it mean to present data effectively?
Stephanie Evergreen: At the very core, that means people understand what we are trying to say. Which means we will have to adjust how we talk about our work so it aligns with how humans come to understand things. So with a little bit of the research behind how brains work, we end up with many significant implications for how we report.
What makes presenting data effectively so challenging?
Stephanie Evergreen: The hardest part is uprooting the ways we have been taught to present, usually from academia. You know what I mean. Lots of bullet points. Dense slides. Too much detail. We think we have to come off this way because it will show we are studious, thorough, and very smart. But reality is that it will only confuse our audiences. And if we are confusing our audiences, we aren’t doing our job. It actually takes in-depth knowledge about a topic to be able to convey it to others with clarity.
What should readers expect to learn and apply to their own presentations?
Stephanie Evergreen: Readers will learn extremely practical guidelines to apply AND the buttons to push to make it happen, right inside the software we all already own.
Is there an ideal balance of text and visuals on a presentation slide?
Stephanie Evergreen: Slides are intended to be a visual support for our talk. So the ideal balance is enough text to frame your key point and a visual that provides the evidence or context for that key point.
How do you help people that are told to only use the company’s colors, fonts and presentation templates?
Stephanie Evergreen: Use them very well. And look for the places where the style guide *doesn’t* dictate your choices – such a font size – and do your magic in those gaps.
What are your thoughts on animated slide transitions and/or clicking to reveal different pieces of information on a slide.
Stephanie Evergreen: Please no transitions. The last thing you want is people thinking “oooh look at how her slide swept away like an ocean tide” because while they are thinking that, they’ve missed everything you were saying. Animating is a different story. Animation can be helpful to break down complex stuff and make it easier to digest. Just don’t be obnoxious (Swivel In, I’m talking about you).
How difficult is it to choose the right chart style?
Stephanie Evergreen: We have a lot of choices, so it can be difficult to even know where to begin. But if you start with your point – the thing you are actually trying to say with this data – you’re headed in the right direction. And coming up with your point, as in really doing the thinking and the analysis, is the hard part.
Is complexity the enemy of good data visualization design?
Stephanie Evergreen: Heck no! Clutter is the enemy of good data visualization design. Complex stuff can be clear and easy if we strip out all the junk.
How do you make it look so easy?
Stephanie Evergreen: I’m funny.
Is there a website to go along with the book?
Stephanie Evergreen: My website rocks. http://stephanieevergreen.com/ My blog is full of tons of resources and I put out new posts every other week that show you exactly how to do what I do. Books are awesome but they take 6 months to print and in that time, I’ve already had a dozen new ideas and the blog is where you’ll find them.
Are you speaking at any upcoming presentations or webinars?
Stephanie Evergreen: I’m on the road, criss-crossing the globe, working with truly awesome folks, giving keynotes and workshops about 35% of my life (typing on a plane right now). Check out my events here: http://stephanieevergreen.com/upcoming-events/ and come say hi or bring me in yourself.
Where’s the best place to follow you online?
Stephanie Evergreen: Dataviz nerds hang out on Twitter, so catch me there https://twitter.com/evergreendata . You can also follow my travel adventures on Instagram at: https://www.instagram.com/severgreen/


 Randy
Randy

Reader Comments