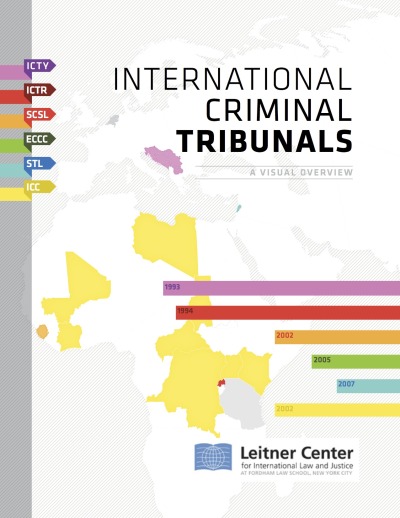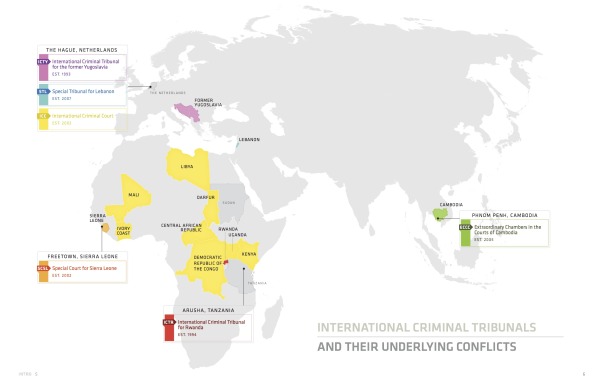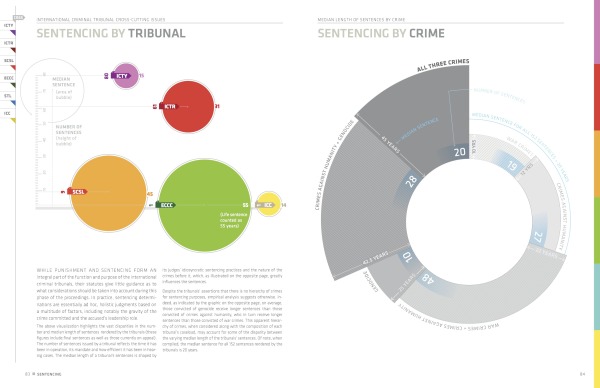
Very cool report that uses data visualization and infographics design to communicate complex information about International Criminal Tribunals from the Leitner Center for International Law and Justice at Fordham Law School, New York City.
The Leitner Center launches a new report, “International Criminal Tribunals: A Visual Overview,” providing an introduction to the work of the international tribunals and the conflicts which led to their establishment. Despite widespread interest in these tribunals and the view that they represent a definitive advance of international law and justice, there is also much confusion and misconception about their work. This new 90-page report, providing analysis and information through written summaries and detailed visualizations, aims to make the work of the courts more accessible to the general public and legal professionals alike.
Media attention dedicated to the work of the tribunals is too often superficial, and tends to confuse key distinctions between them; more informed scholarship, on the other hand, is largely confined to specialty publications, remaining inaccessible to most. “International Criminal Tribunals: A Visual Overview,” aims to provide well-researched and accessible information for anyone wishing to more fully understand these issues. This will help democratize engagement with these courts, which are tasked with delivering justice for victims of some of the world’s worst atrocities. Examples of the visual graphics in the report are included below.


Awesome use of different styles of data visualization to summarize the often-complex information behind these tribunals. Timelines, maps, area charts, polar grids, rose diagrams and treemaps. The Case-by-Case timeline are fascinating.
The complete report is publicly available as a PDF for download.
I asked Daniel McLaughlin a few questions about the development and design of the report:
Cool Infographics: What software, websites or tools did you use to create the visualizations?
Daniel: We used Adobe Illustrator and InDesign to create the visuals for the report.
Cool Infographics: Did you create the report yourself, or use a design team?
Daniel: As a lawyer working with law students on this project, I was dependent on graphic and information design volunteers to create the visuals. The students and I carried out all the substantive research and then worked with these volunteers to figure out how best to translate it visually. Paula Airth of www.bepeculiar.com, in particular, was instrumental in bringing the project to life.
Cool Infographics: How long did the report take to design and put together?
Daniel: The report started out as a short (8-9 page) publication on the work of the international criminal tribunals. It grew into the present 90 page version as we continued to accumulate new data and the graphic/information design volunteers continued to create new graphics. All told, the research took around 4 months and the creation of the visuals/layout took another 5 months or so.
Cool Infographics: How has the use of data visualization design and social media impacted your marketing?
Daniel: The goal of this publication was to make the work of the international criminal tribunals more accessible to lawyers and non-lawyers alike. As indicated in the publication,
“There is wide awareness, though little true understanding, of the work of the international criminal tribunals. International prosecutions of high-ranking civilian and military leaders, including former heads of state, on charges of crimes against humanity, war crimes and genocide, represent for many the ultimate condemnation of these individuals’ past actions and a measure of their fall from power. Yet, despite the tribunals’ grasp on the popular imagination, they are the subject of significant misconceptions and confusion. Much of the media coverage dedicated to their work remains superficial, at best, and largely muddles over key distinctions between various tribunals, past and present. Conversely, the more informed scholarship is largely confined to specialty publications that remain inaccessible to most. In truth, many lawyers and non-lawyers alike lack a clear understanding of the role and functioning of these increasingly-pivotal international institutions. This publication seeks to redress this knowledge gap by providing well-researched and accessible information for those wishing to more fully understand the international criminal tribunals and the conflicts over which they have jurisdiction. An informed public is an engaged public - and the issues that animate these tribunals, including delivering justice for victims of some of the world’s worst atrocities, are too significant to be discussed solely by a small cadre of international criminal law specialists.
Notably, this publication was created in partnership with graphic and information designers so as to reach a broader public. The designers’ visualizations present information regarding the tribunals and their underlying conflicts in a direct and accessible manner to a wide range of viewers, including those without a legal background. Beyond this democratizing function, information visualization also serves to reveal important data and trends that might otherwise go unnoticed in a more conventional format. Ideally, the following information, which is current as of January 2013, would be integrated into a continually updated interactive webportal dedicated to engaging a global public on issues of international justice.
In sum, this publication aims to facilitate a broader discussion of the international criminal tribunals’ notable accomplishments, as well as ongoing shortcomings.”
Thanks to Daniel McLaughlin for sending in the link!


 Randy
Randy


