About
Randy Krum
President of InfoNewt.
Data Visualization and Infographic Design

Infographic Design

Infographics Design | Presentations
Consulting | Data Visualizations

DFW DataViz Meetup

Join the DFW Data Visualization and Infographics Meetup Group if you're in the Dallas/Fort Worth area!

Search the Cool Infographics site

Custom Search

Subscriptions:


Feedburner

The Cool Infographics® Gallery:

How to add the
Cool Infographics button to your:

Cool Infographics iOS icon

- iPhone
- iPad
- iPod Touch


Read on Flipboard for iPad and iPhone

Featured in the Tech & Science category

Flipboard icon

Twitter Feed
From the Bookstore

Caffeine Poster

The Caffeine Poster infographic

Entries in Legal (7)

Friday
Jun122015

Death By Boating Under the Influence

Death By Boating Under the Influence Infographic

The Never BUI (Boating Under the Influence) infographic helps share some of the grim statistics about the boating deaths caused by alcohol. This is a perfect topic for an infographic by Boat Ed, a source for Official Boater Safety Courses and Boat Safety Education Materials.

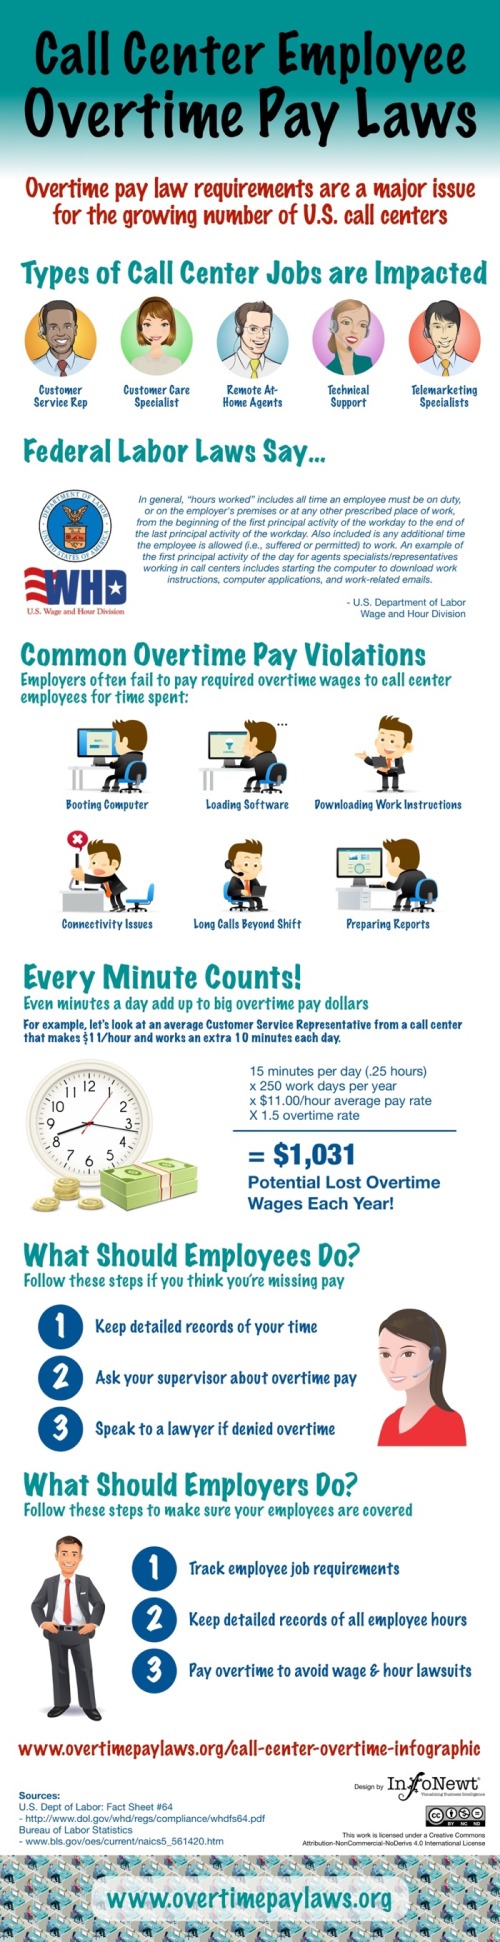
Before the thought of drinking on a boat crosses your mind, consider the physical and legal consequences of boating under the influence of alcohol. Not only is operating a boat while intoxicated illegal in all 50 states, it’s also dangerous and can have deadly consequences.

Alcohol use is the leading known contributing factor in fatal boating accidents; where the primary cause was known, it was listed as the leading factor in 21% of deaths. Safe boating means never boating under the influence (BUI).

Safe boating means sober boating. While it may be tempting to crack open a can of beer while cruising, keep in mind that your record, license, and life may be at stake!

I really like this design. Simple, clean design that focuses on telling one story really well. Easy to read. Easy to Understand the data. Easy to share. 

Thanks to Joe for sending in the link!

Friday
Feb272015

Overtime Pay Laws

Call Center Employee Overtime Pay Laws infographic

The Call Center Employee Overtime Pay Laws infographic from overtimepaylaws.org is in informative design can help both employees and employers understand the rules when it comes to paying overtime.

Call centers employ thousands of workers throughout the United States. Many call center employees are required to perform tasks before a shift and after a shift that are not considered “on the clock” by their employer, such as booting up a computer or loading dialing software. This additional time spent on these tasks can give rise to an overtime pay lawsuit brought under the Fair Labor Standards Act. Our Call Center Overtime Pay Infographic Explains the important issues in these cases.

This design follows a simple story format with only a few steps:

  1. What’s the Problem?
  2. What’s the Impact?
  3. What can the Reader do?

 I love that this design simplifies the information, and doesn’t try to include too much detail.

Monday
Jun182012

Client Infographic: U.S. Motorcycle Helmet Laws

Client Infographic U.S. Motorcycle Helmet Laws

This was a fun project to work on.  The Helmet Laws infographic is a visual reference for all motorcycle riders of the state-by-state helmet laws in the U.S., and also includes a few fact about the states with the highest fines and longest jail time as punishment for breaking those laws.  It’s a light-hearted design meant to make the complex mix of legal requirements easier to understand, because often riders don’t take the time to understand the laws as they cross state borders.

We are actively pursuing lawsuits for injured Michigan motorcyclists and wanted to create an infographic that would be a great resource for riders! The Helmet Laws infographic also displays which states have the highest fines and maximum jail time for violating their helmet law. You should share this infographic with other avid bikers who may be taking a ride across state lines

Only three states have no helmet laws at all (Iowa, Illinois and New Hampshire), and 20 states have strict, mandatory helmet laws.  The remaining 28 states fall somewhere in between (Total of 51 because the District of Columbia is included).

Client Infographic U.S. Motorcycle Helmet Laws Wallet Card

FREE Wallet Cards!  (No longer available)


As an added bonus, small wallet-size card (like a credit card) were printed by Buckfire Law that show just the map visualization and are available FREE to anyone that requests them!  These are meant for any motorcycle rider in the country to carry as a quick reference guide while riding.  You can find the instructions to request a free card on the Motorcycle page of the Buckfire site.  Scroll down past the infographic on their site and you’ll find the link to the online form.  Fill it out, and they will mail one to you for free, so share with anyone you know that rides.

Client Infographic U.S. Motorcycle Helmet Laws Wallet Card Photo

InfoNewt worked with Buckfire & Buckfire Law to develop the design and the wallet card program.  Thanks to the team at Buckfire for being great to work with!

Wednesday
Sep142011

Google in 2011: Courtroom & Boardroom

Google in 2011: Courtroom & Boardroom is a new infographic from Search Influence.  At it’s heart, this is a timeline history of acquisition and courtroom events through the first nine months of 2011, but there is a lot going on here.

Events are laid out in a psuedo-calendar format for each month, flagged by country and shaded to indicate win or loss.  The change in stock price is also shown for the actual day of each event, but even though this implies the event’s impact to stock price, there are always many more factors driving price changes.  Events are connected by colored lines to indicate on-going events and the related division of Google’s business.

I hope they keep evolving this design.  In it’s current state, it’s a little hard to follow, but I love the multiple layers of data represented.  This design could evolve to be more easily readable, and even be applied to other companies as well.

Thanks to Matt for sending in the link!


Wednesday
May112011

Student Bullying infographic

Student Bullying
[Source: Buckfire and Buckfire.com]

From Buckfire & Buckfire in Michigan, comes an infographic about Student Bullying in the U.S.

Student bullying in schools in the United States is a serious issue and very prevalent in our school systems today. The statistics show that a student is bullied every seven minutes in our country and that most bullying occurs on playgrounds. The effects of bullying are profound and have a major psychological impact on the bullied student and often causes learning problems in the classroom.

The majority of states have bullying laws on the books, but most are not significant enough to impact this problem or reduce the amount of bullying that occurs nationwide. Without more stringent laws and the actual enforcement of those laws, school systems will not feel the pressure to take the affirmative measures necessary to eliminate the bullying problem that terrorizes so many innocent and vulnerable children everyday.

The lawyers at our law firm receive calls from concerned parents every week about their children who are being bullied in Michigan schools. We are actively pursuing lawsuits in several cases. We created the infographic below to display the facts and statistics about student bullying.

I really like the statistics shared in this one, although they should have visualized more of the numbers.  A value like 160,000 students miss school every day out of fear could be put into context if they had visualized it in comparison to total students or something like that.  

I really like the fact that since they get so many calls from parents, that they chose an infographic to reach out to their customers to share some of the facts.  This is a great example of using an infographic to provide valuable information to parents and teachers everywhere.  People will share it because it’s good content, and some may eventually become new customers.

Thanks to Kathryn for the link!

Wednesday
Oct132010

More Lawsuits in the Mobile Business

George Kokkinidis from Design Language News made another great infographic redesign of the Lawsuits in the Mobile Business.  A significant improvement over the original diagrams in The Guardian and the NYTimes.

An attempt at redesigning this chart from The Guardian to make the plaintiffs and defendants a bit more clear.

Although this doesn’t add the additional data dimensions of company revenues like “Who’s Suing Whom?”, this diagram is much easier to read and understand than the originals.

Great job George, and thanks for the link!

Wednesday
Oct062010

Who’s Suing Whom: Lawsuits In The Telecoms Trade infographic


Who’s Suing Whom is a great infographic design improvement by David McCandless from InformationIsBeautiful.net.  David took existing diagrams (which were pretty poor) from The Guardian and the NY Times, and created a much more compelling and information-rich infographic.  My feeling from the news is that there are many more lawsuits that these, but I don’t know the data.

Based on these diagrams from Guardian Tech and the NY Times.

I thought those charts generated more questions than they answered. So, as ever, I tried to answer the obvious questions and convey various contexts simultaneously.

I wondered, too, if I could design the connections so the lines didn’t cross. Almost managed it!

And see if there was a relationship between dropping revenues and litigiousness. What do you think? Is there?

Data: http://bit.ly/sosueme


Great job David!