About
Randy Krum
President of InfoNewt.
Data Visualization and Infographic Design

Infographic Design

Infographics Design | Presentations
Consulting | Data Visualizations

DFW DataViz Meetup

Join the DFW Data Visualization and Infographics Meetup Group if you're in the Dallas/Fort Worth area!

Search the Cool Infographics site

Custom Search

Subscriptions:


Feedburner

The Cool Infographics® Gallery:

How to add the
Cool Infographics button to your:

Cool Infographics iOS icon

- iPhone
- iPad
- iPod Touch


Read on Flipboard for iPad and iPhone

Featured in the Tech & Science category

Flipboard icon

Twitter Feed
From the Bookstore

Caffeine Poster

The Caffeine Poster infographic

Entries in motorcycle (4)

Wednesday
Nov192014

Convert Your Street Bike into a CafĂ© Racer

 Convert Your Street Bike into a Café Racer infographic

Looking for a project? Have a street bike laying around? Then why not change it into a Café Racer?!? The Convert Your Street Bike into a Café Racer infographic from Fix gives some great before and after pictures of the conversion.

It was in the U.K. during the 1960s that a new style of motorcycle was born. Racing enthusiasts took their Triumphs and BSAs and added all sorts of racy-looking accessories and engine tuning components. Not content with a bike that just looked like a racer, the owners would often have impromptu races between the many cafés that dotted the English countryside.

Although café racers come in many custom forms, there are some commonalities that run throughout the design. With the lowering of the handlebars and changing of the gas tank and seat, the outline of the bike becomes more curved. It is important that the café racer is not clumsy in appearance. With parts brought toward the center of the bike, the bike becomes more visually aggressive. The gas tank and “humpback” seat (described below) mirror each other, accentuating the curved look.

Today, for the owner-rider wanting to replicate the ’60s look of a café racer, the good news is that there are many over-the-counter parts for the most popular bikes. Adapting some of these café racer parts to fit any bike is not out of the question but may require some basic engineering.

Great How-To design that makes everything visual! The sections are also broken up as separate images on the Fix.com site.

The infographic is missing any URLs back to the host site or the original infographic landing page.

Thanks to Jesse for sending in the link!

Friday
Nov162012

Choosing the Right Line - The Science of Corners

Choosing the Right Line- The Science of Corners infographic

Choosing the Right Line- The Science of Corners infographic is a design about Motocross.  Motocrossgear.com takes the science of successfully navigating corners in motocross racing and brings it to the infographic world. 

Since the beginning of racing, riders have been faced with many choices on the track. The fastest rider is often the one who chooses the best lines on the track. Many factors exist when deciding which line to take through a corner. Use this visual guide to help you pick the fastest line.

Not a design based on a lot of data, this visual explanation relies more on diagrams to communicate the message.  In general, I really like the design style that reinforces the feel of motorcross, but in my opinion this could be a better design with less text.

Thanks to John for sending in the link!

Monday
Jun182012

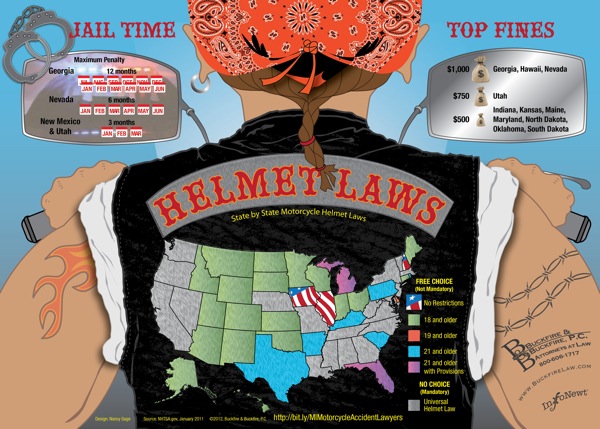
Client Infographic: U.S. Motorcycle Helmet Laws

Client Infographic U.S. Motorcycle Helmet Laws

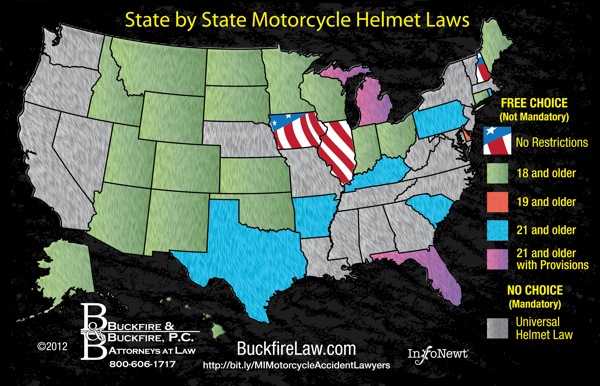
This was a fun project to work on.  The Helmet Laws infographic is a visual reference for all motorcycle riders of the state-by-state helmet laws in the U.S., and also includes a few fact about the states with the highest fines and longest jail time as punishment for breaking those laws.  It’s a light-hearted design meant to make the complex mix of legal requirements easier to understand, because often riders don’t take the time to understand the laws as they cross state borders.

We are actively pursuing lawsuits for injured Michigan motorcyclists and wanted to create an infographic that would be a great resource for riders! The Helmet Laws infographic also displays which states have the highest fines and maximum jail time for violating their helmet law. You should share this infographic with other avid bikers who may be taking a ride across state lines

Only three states have no helmet laws at all (Iowa, Illinois and New Hampshire), and 20 states have strict, mandatory helmet laws.  The remaining 28 states fall somewhere in between (Total of 51 because the District of Columbia is included).

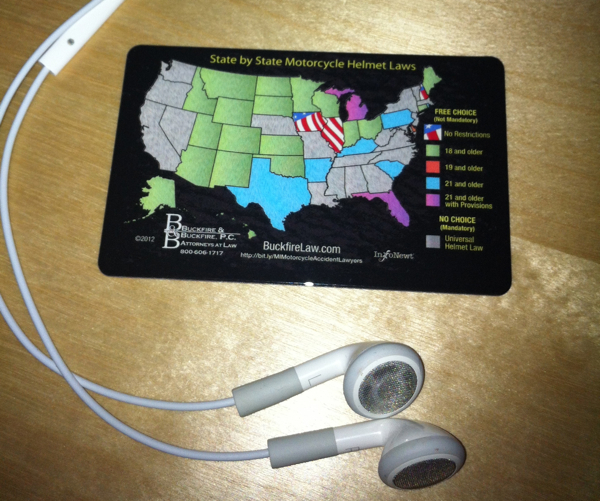
Client Infographic U.S. Motorcycle Helmet Laws Wallet Card

FREE Wallet Cards!  (No longer available)


As an added bonus, small wallet-size card (like a credit card) were printed by Buckfire Law that show just the map visualization and are available FREE to anyone that requests them!  These are meant for any motorcycle rider in the country to carry as a quick reference guide while riding.  You can find the instructions to request a free card on the Motorcycle page of the Buckfire site.  Scroll down past the infographic on their site and you’ll find the link to the online form.  Fill it out, and they will mail one to you for free, so share with anyone you know that rides.

Client Infographic U.S. Motorcycle Helmet Laws Wallet Card Photo

InfoNewt worked with Buckfire & Buckfire Law to develop the design and the wallet card program.  Thanks to the team at Buckfire for being great to work with!

Tuesday
Mar272012

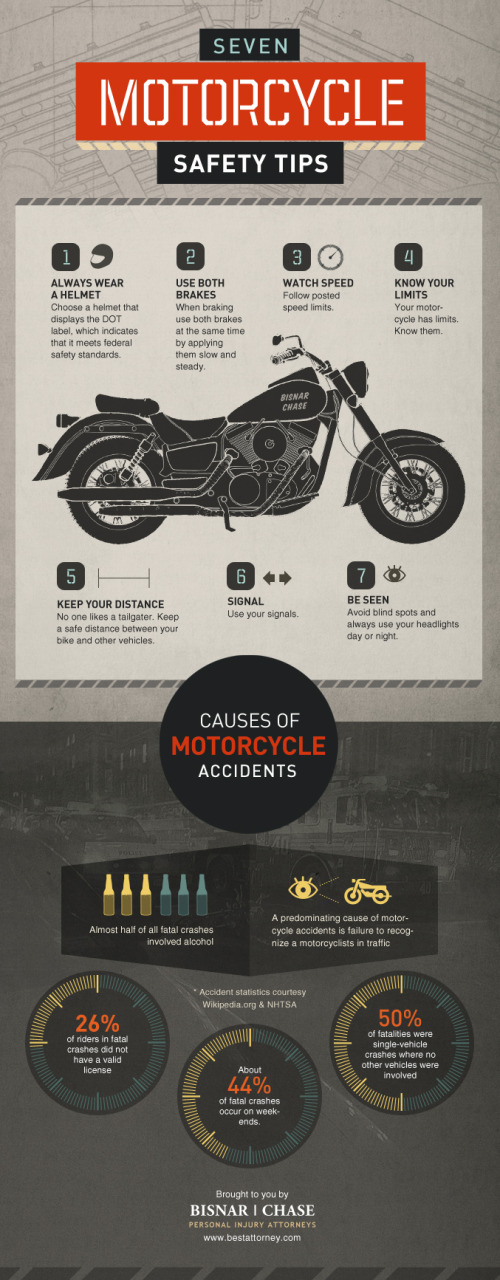
Seven Motorcycle Safety Tips

The Seven Motorcycle Safety Tips infographic comes to us from Bisnar|Chase. This infographic gives some helpful tips on saftey to prevent injuries, but if you do have an accident, they’d like to help!

Motorcycle safety is no joking matter. Please take your safety seriously. If you do become injured in a motorcycle accident we would like to help. Contact us immediately to schedule your free consultation with our reputable California motorcycle accident lawyers.

A couple things I really like about this design.

  • It tells a simple, easy-to-understand story
  • Clean design, not too much visual noise
  • Good illustrations to illustrate each safety tip and statistic
  • Each of the values included are visualized to make them quick and easily to read

The data source is listed in the infographic, but it’s missing a copyright statement and a URL to the original infographic posting at the bottom.  The page with the original posting is also missing sharing buttons for social media, so it’s difficult for readers to share the infographic.

Thanks to Chris for sending in the link!