About
Randy Krum
President of InfoNewt.
Data Visualization and Infographic Design

Infographic Design

Infographics Design | Presentations
Consulting | Data Visualizations

DFW DataViz Meetup

Join the DFW Data Visualization and Infographics Meetup Group if you're in the Dallas/Fort Worth area!

Search the Cool Infographics site

Custom Search

Subscriptions:


Feedburner

The Cool Infographics® Gallery:

How to add the
Cool Infographics button to your:

Cool Infographics iOS icon

- iPhone
- iPad
- iPod Touch


Read on Flipboard for iPad and iPhone

Featured in the Tech & Science category

Flipboard icon

Twitter Feed
From the Bookstore

Caffeine Poster

The Caffeine Poster infographic

« Multitasking: This Is Your Brain On Media | Main | The Anatomy of a Vegan »
Wednesday
Jan112012

Calendar Visualization of Fatal Car Crashes

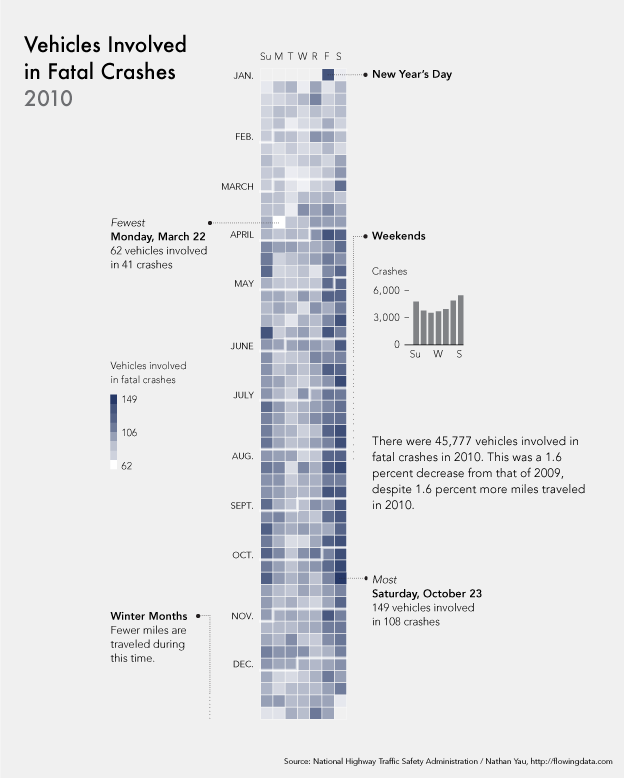
I really like this data visualization from Nathan Yau at FlowingData.comVehicles Involved in Fatal Crashes 2010 takes a new look at the statistics released by the U.S. National Highway Traffic Safety Administration.  Instead of plotting them on a traditional map, Nathan looked at the time data.

After seeing this map on The Guardian, I was curious about what other data was available from the National Highway Traffic Safety Association. It turns out there’s a lot and it’s relatively easy to access via FTP. What’s most surprising is that it’s detailed and fairly complete, with columns for weather, number of people involved, date and time of accidents, and a lot more.

The above shows vehicles involved in fatal crashes in 2010 (which is different from number of crashes or number of fatalities). This data was just released last month, at the end of 2011 oddly enough. It’s a calendar view with months stacked on top of one another and darker days indicate more vehicles involved.

- Nathan Yau

As was suggested by others in the comments on FlowingData, I agree that since the weekends have the higher incidence rate, starting the week with Monday and moving Sunday to the last column may show that a little bit clearer.

Nathan has made all of the data avaialble for anyone that would like to try a visualization themselves.  Student project?

PrintView Printer Friendly Version

EmailEmail Article to Friend

Reader Comments (3)

Seeing so many people getting involved per day. i wish i could help them or even just help them them prevent it.
January 21, 2012 | Unregistered CommenterTyre Changers
Neat blog! Is your theme custom made or did you download it from somewhere? A theme like yours with a few simple tweeks would really make my blog shine. Please let me know where you got your theme. Thanks

<a href="http://locksmithgreensboronc.net/">Locksmith Greensboro Nc</a>
February 9, 2012 | Unregistered Commenterjon
The image look likes a timeline. It shows there the different information and details about the concept on the blog.
March 4, 2012 | Unregistered Commentertyre changers
Comments for this entry have been disabled. Additional comments may not be added to this entry at this time.