About
Randy Krum
President of InfoNewt.
Data Visualization and Infographic Design

Infographic Design

Infographics Design | Presentations
Consulting | Data Visualizations

DFW DataViz Meetup

Join the DFW Data Visualization and Infographics Meetup Group if you're in the Dallas/Fort Worth area!

Search the Cool Infographics site

Custom Search

Subscriptions:


Feedburner

The Cool Infographics® Gallery:

How to add the
Cool Infographics button to your:

Cool Infographics iOS icon

- iPhone
- iPad
- iPod Touch


Read on Flipboard for iPad and iPhone

Featured in the Tech & Science category

Flipboard icon

Twitter Feed
From the Bookstore

Caffeine Poster

The Caffeine Poster infographic

Entries in solar (3)

Monday
Aug212017

Eclipse: What You Need To Know

Eclipse: What You Need To Know infographic

What are your plans to view the eclipse today? The Eclipse: What You Need To Know infographic from Forbes contributor and designer Kevin Anderton.

On August the 21st 2017, there will be a solar eclipse in the sky over the United States. If you are like me, you are planning on enjoying this amazing site and you have probably also heard that there is some danger in viewing it. Here is some information that will help you safely enjoy the eclipse next Monday.


Wednesday
Jun222016

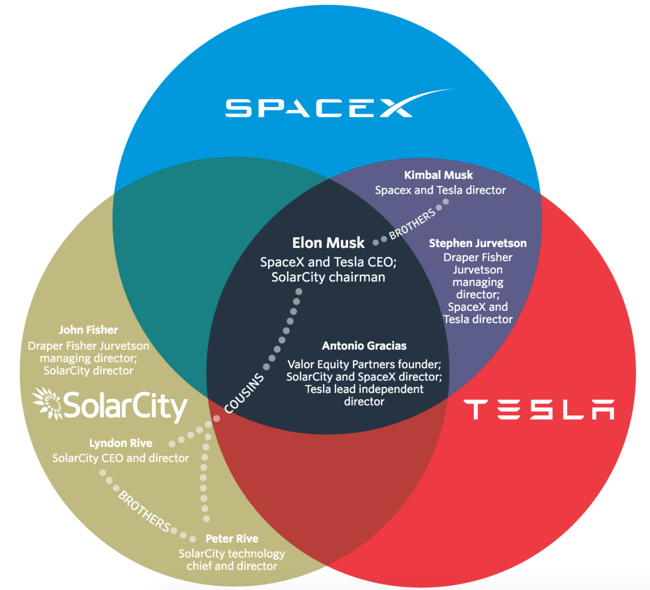
Venn Diagram shows Tesla-SolarCity-SpaceX overlap

Venn Diagram shows Tesla-SolarCity-SpaceX overlap

Yesterday (June 21, 2016) Tesla Motors offered to acquire SolarCity for $2.8 billion in stock. Unless you pay close attention, you may not realize that these are both companies headed by Elon Musk. The Wall Street Journal (subscription required) has visualized the shared investors and board members with this clear Venn Diagram showing the overlap between his three companies: Tesla, SolarCity and SpaceX.

The graphic helps put the merger news into context for the readers. The best infographics and data visualizations make complex information more approachable and understandable for the audience, and this one does that very well.

Found on TechCrunch, where you can see the design.

Tuesday
Aug092011

Client Infographic: A Solar Innovation Story

Solar Savings: A Solar Innovation Story from ExtraSpace.com is a new infographic by InfoNewt and designer Jeremy Yingling.  This one tells the story of how the company is adding solar panels to the roof space on some of it’s self storage facilities all across the country.  The environmental, financial and community benefits are huge, and this was only the first year of a multi-year plan.

Extra Space Storage is on a mission to produce solar powered clean energy and reduce the carbon footprint of our 850+ self storage facilities. We aim to install 20,000 solar panels this year, and increase the pace of panel installation every year. Energy efficient clean power is good for our customers and our neighborhoods, our planet, and our investors. By the end of 2011 this program will save 2,000 tons of carbon dioxide and 100 acres of fir trees.

An infographic is a fantastic way for Extra Space to tell their story to customers, investors and anyone interested in alternative energy solutions.  It puts their efforts into context and shows the potential of how large their cumulative environmental impact could become.

You can follow Extra Space Storage on Facebook and Twitter (@extraspace)