


Winnipeg Jets Beat Arizona Coyotes Infographic
 Randy
Randy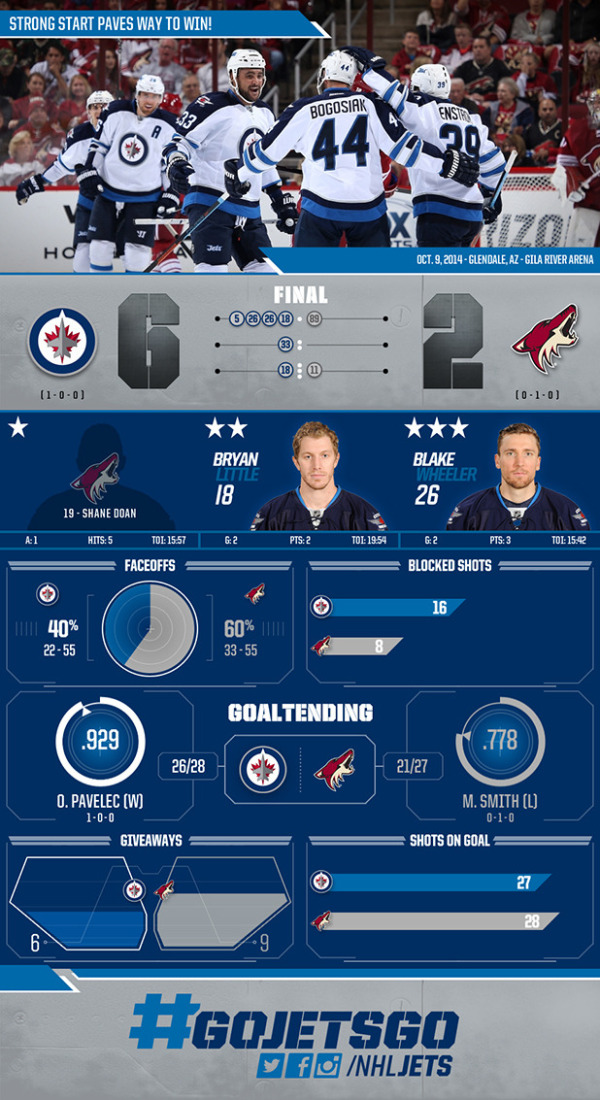
Jets Down Arizona 6-2 infographic from the Winnipeg Jets (Jets.NHL) gives an infographic summary of the October 9, 2014 NHL game between the Jets and the Coyotes. Sports statistics are ripe for data visualization and infographics, but are so rarely used.
The design does a great job of using a few simple visualizations to communicate data about the game. They don’t just show the score, but visualize when the goals were made by using the numbers of the scoring players shown in each period. Other visualizations cover statistics like Face-off results and Goal Tending percentages.
I don’t understand the visualization for the Giveaways. I get that the filled area is supposed to represent the number, but the’re shown in a shape I don’t recognize. Is that a car door? There’s no way the designer accurately calculated the area shown of that odd shape to get the visualization right.
Thanks to Reid Parker for posting the link!
