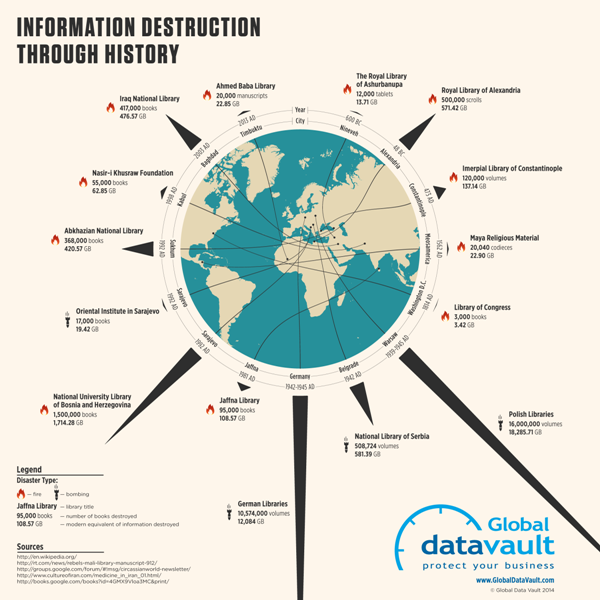
Information Destruction Through History
Information Destruction Through History from Global Data Vault explores and quantifies the worst data disasters in history.
Information the most valuable commodity in the world. All human progress depends on the accumulation and preservation of information. When information is lost, human progress suffers. This infographic displays some of the most significant loses of information human civilization has suffered.
The circular timeline shows the data disaster events in chronological order, while also connecting to their geographic locations. The triangles are proportionally sized so readers can visually compare the modern data equivalents between the events. This really helps put the disasters into perspective for the audience.
A great infographic design that tells one story really well, but there are a few things I would recommend to improve the design:
- I wouldn’t have any of the triangles run off the page, because the audience will lose perspective on how disastrous those specific events were. Show the full impact of those events to the readers.
- Add the URL directly to the infographic landing page so readers can find the original full-size version when people don’t link back correctly
- I wouldn’t list Wikipedia as a data source if possible. Track the Wikipedia references back to the original data source to include in the list.
Thanks to Joe for sending in the link!


 Randy
Randy

Reader Comments (2)
First: converting an amount of lost manuscripts into gigabytes somewhat make it seem like there haven't been lost much. You see, 1/2 TB of porn lost in Alexandria is quite nothing, that's for sure. We are not only used to the numbers of this magnitude - we are using them daily to designate the amount of crap - for instance last week we have allocated 35 TB on the working server... for nothing less important than the temporal data.
Second problem is comparability. One can't simply compare recent events with ancient. For example: many of the lost books in Bosnia NL are most likely still preserved somewhere else, while nothing what has been lost in Alexandria could ever be recovered - "...the library held 1.5 million volumes and over 155,000 rare books and manuscripts" - http://en.wikipedia.org/wiki/National_and_University_Library_of_Bosnia_and_Herzegovina - hence although the amount of data lost is higher in first case, the latter is of much greater significance.
Plus it seems like there's something very important missing - the shadow of the oldest archenemy of the man - his government: "Alleged digitization effort to reduce the nine original libraries to seven and save $C443,000 annual cost. It is alleged that only 5–6% of the material was digitized, and that scientific records and research created at a taxpayer cost of tens of millions of dollars was dumped, burned, and given away. Particularly noted are baseline data important to ecological research, and data from 19th century exploration." - Libraries of Fisheries and Oceans, Canada, 2013AD. see: http://en.wikipedia.org/wiki/Destruction_of_libraries
My conclusion therefore is that this infographic is pretty shallow but could be worse.
PS. Information is NOT the most valuable commodity in the world. It is the most common one. Everything is made out from data. The world is mere database. You, me, the rest of the universe. Probably by "the most valuable commodity" was meant that "information realized, gained, known and understood is the most valuable commodity".
Let me put an example: the fact everything is made from data is an information - it didn't have any significance or value for you just because of its existence per se, but it might have a great value for you once you learn about it.
Have a nice day.
Corrupted information is also rampant...