About
Randy Krum
President of InfoNewt.
Data Visualization and Infographic Design

Infographic Design

Infographics Design | Presentations
Consulting | Data Visualizations

DFW DataViz Meetup

Join the DFW Data Visualization and Infographics Meetup Group if you're in the Dallas/Fort Worth area!

Search the Cool Infographics site

Custom Search

Subscriptions:


Feedburner

The Cool Infographics® Gallery:

How to add the
Cool Infographics button to your:

Cool Infographics iOS icon

- iPhone
- iPad
- iPod Touch


Read on Flipboard for iPad and iPhone

Featured in the Tech & Science category

Flipboard icon

Twitter Feed
From the Bookstore

Caffeine Poster

The Caffeine Poster infographic

Entries in war (18)

Wednesday
Apr022008

Star Wars Toy Collection


Josh Budich has created the website My Star Wars Collection to share his personal collection of over 600 Star Wars figures. He has created a pixel image of each figure in his collection. Moving you mouse over the image brings up the name of the character, and clicking brings up a photo of the figure still in its packaging. The are a number of ways to narrow down the assortment by figure series, movie the character appeared in or year the figure was released.

Thanks Torquil for sending this one in.

Wednesday
Mar192008

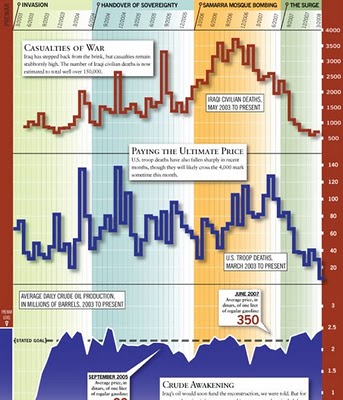
Iraq by the Numbers


From foreignpolicy.com, a really tall chart showing statistical information covering the last five years of the Iraq war. I'm not sure I like the idea of this big chart that covers so many different types of data. The information on the bottom half of the chart tends to get lost to the reader.

Tuesday
Feb262008

Infographics for Advocacy


I got a note from John Emerson, the author of Visualizing Information for Advocacy, and I wanted to share that his booklet on using infographics for NGO's and advocacy organizations is now available online as a free PDF (6.9MB) at apperceptive.com. Although geared to advocacy groups, the information is definitely relevant to everyone.

John also has a blog post up on Social Design Notes.

Outstanding job John!

Friday
Feb152008

5,000 years of Faith


From mapsofwar.com, this is a 90-second flash video showing when the major religions formed and where they spread across the globe. Great combination of a map with a timeline.

Found on digg.com

Monday
Feb042008

Who has the Nuclear Weapons?

An infographic video from GOOD Magazine, a quick 3-minute video that shows who has the nukes, how many they have, and how much damage would one nuke hitting the Empire State Building cause.

Found on tunequest.org

Tuesday
Jan082008

One Year in Iraq


New infographic from nytimes.com depicting the 2,592 deaths in Iraq over the course of the entire year of 2007. The graphic is credited to Alicia Cheng, a graphic designer at mgmt. design in Brooklyn.

The chart below — compiled from data provided by the American and Iraqi governments and news media organizations (the independent Coalition Casualty Count in particular) — gives information on the type and location of each attack responsible for the 2,592 recorded deaths among American and other coalition troops, Iraqi security forces and members of the peshmerga militias controlled by the Kurdish government.

I think this is an improvement over the "31 Days in Iraq" graphic because the new graphic identifies every death as a separate figure instead of grouping some together. There are also some differences in data, as the new graph doesn't include the Iraqi civilian deaths. So the "31 Days in Iraq" graphic showed over 1,900 deaths in January 2007, this new graphic only shows 163 deaths in January.
And, sadly, civilian fatalities in Iraq last year were simply too numerous to represent on a single newspaper page.

I'll keep an eye out in early February to see if they publish one for the month of January as they have the last couple of years.

Monday
Jan072008

The Software Wars

Found originally on Digg Images, this one is hosted on Steven Hilton's website (the author).


I guess you could call this a Mind Map style, but it's more like a Battlefield style infographic. I really like how it shows the products that multiple competitors are challenging Microsoft with and the associated product on the Microsoft side that is being challenged.

Monday
Sep242007

31 Days in Iraq

This map of Iraq from the NYTimes.com visually shows the over 1,900 people killed in Iraq during the month of January 2007.

"The map, based on data from the American, British and Iraqi governments and from news reports, shows the dates, locations and circumstances of deaths."
The number has doubled since they did this for January 2006 which had around 800 deaths. Each figure represents an individual of the American forces, coalition forces, Iraqi forces, police officers or civilian death. The larger figures have numbers showing how many people they represent (which I think diminishes the visual impact). A smaller icon shows the cause of death. All the figures are connected to a location in the country.

I would have added some color coding too, but I'm guessing the NY Times had to keep it in black & white to print it in the newspaper.

Page 1 2