About
Randy Krum
President of InfoNewt.
Data Visualization and Infographic Design

Infographic Design

Infographics Design | Presentations
Consulting | Data Visualizations

DFW DataViz Meetup

Join the DFW Data Visualization and Infographics Meetup Group if you're in the Dallas/Fort Worth area!

Search the Cool Infographics site

Custom Search

Subscriptions:


Feedburner

The Cool Infographics® Gallery:

How to add the
Cool Infographics button to your:

Cool Infographics iOS icon

- iPhone
- iPad
- iPod Touch


Read on Flipboard for iPad and iPhone

Featured in the Tech & Science category

Flipboard icon

Twitter Feed
From the Bookstore

Caffeine Poster

The Caffeine Poster infographic

« Name that Color | Main | New York Talk Exchange »
Wednesday
Mar192008

Iraq by the Numbers


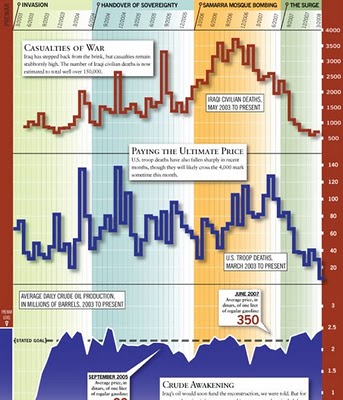
From foreignpolicy.com, a really tall chart showing statistical information covering the last five years of the Iraq war. I'm not sure I like the idea of this big chart that covers so many different types of data. The information on the bottom half of the chart tends to get lost to the reader.

PrintView Printer Friendly Version

EmailEmail Article to Friend

Reader Comments (1)

I'm not sure I like this chart either... The scales on the right are quite different and a quick look at the chart is misleading. It looks like as many U.S. soldiers as Iraqi died.

March 19, 2008 | Unregistered CommenterAnonymous
Editor Permission Required
While we are migrating to a new site design, you must have editing permission for this entry in order to post comments.