About
Randy Krum
President of InfoNewt.
Data Visualization and Infographic Design

Infographic Design

Infographics Design | Presentations
Consulting | Data Visualizations

DFW DataViz Meetup

Join the DFW Data Visualization and Infographics Meetup Group if you're in the Dallas/Fort Worth area!

Search the Cool Infographics site

Custom Search

Subscriptions:


Feedburner

The Cool Infographics® Gallery:

How to add the
Cool Infographics button to your:

Cool Infographics iOS icon

- iPhone
- iPad
- iPod Touch


Read on Flipboard for iPad and iPhone

Featured in the Tech & Science category

Flipboard icon

Twitter Feed
From the Bookstore

Caffeine Poster

The Caffeine Poster infographic

Entries in zoom (5)

Monday
Jun152015

Infographics Are Evolving into Many Formats

The internet is full of noise, and your job is to break through that wall of information with something that resonates with your target audience. When you are communicating any message, you want to ensure that your audience will understand and remember the valuable takeaways about your products or services. You want your communication to be clear and concise. This is where infographics come in.

Infographics are your opportunity to convey complex ideas and information in a simple and easily digestible manner. Simply put, our brains love visual information. Infographics can make your marketing and advertising stand out in the crowded world of visual content.

As the Internet, our computing devices and out screen sizes continue to evolve and change, infographics need to evolve as well. Moving past the original static images, infographic storytelling with data visualizations and illustrations can now be found in a number of different formats.

Below, are great examples of different ways to leverage the five different types of infographics to make your product or services more memorable.


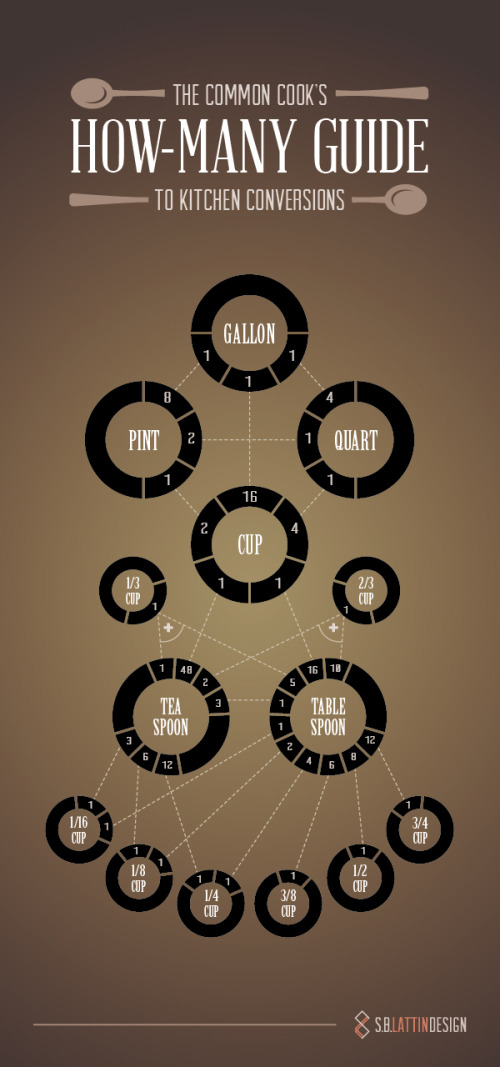
1. Static Infographics - Kitchen Conversion Guide

Static infographics are the most simple and most common infographic format out there. They are usually saved as an image file to be easily distributed and consumed (JPG or PNG format). Static infographics are easily shared using email and social media since there are no moving parts to consider.

The Common Cook’s How-Many Guide to Kitchen Conversations

Source: https://shannon-lattin.squarespace.com/how-many-guide/

This type of infographic is also easily split up into segments in order to focus on one piece at a time. This is ideal for giving presentations or sharing on social media.


2. Interactive Infographics - Daily Dose of Water

Interactive infographics are great to utilize when you want people to move beyond simply looking at the information. Ideally your audience should get intimate with the facts you’re presenting by following a specific storyline told through your data. By giving your audience something to interact with, they are engaging more of their attention with the data, and will become more immersed in the information.

For example, this infographic from Good.is and Levi’s walks users through their typical routine and calculates how much water is used for each task. This allows a personalized experience for each person that views the infographic, creating a stronger connection to the information being shared.

Your Daily Dose of Water

Source: http://awesome.good.is/transparency/web/1204/your-daily-dose-of-water/flash.html


3. Video Infographics - The Fallen of WWII

Video infographics have been gaining popularity over the years in part for a lot of the same reasons static infographics work: the ease of sharing and the ability to embed it almost anywhere.

In this video infographic that has recently gone viral, the creator uses data visualization to make a powerful statement about the sacrifice soldiers made during World War II. Data visualization is used in such a way to show the stark juxtaposition between the Second World War and more modern conflicts.  Check out this quick motion graphic titled, The Fallen of World War II from Austin-based developer Neil Halloran. His use of sound and motion brings the information to life.

The Fallen of World War II from Neil Halloran on Vimeo.


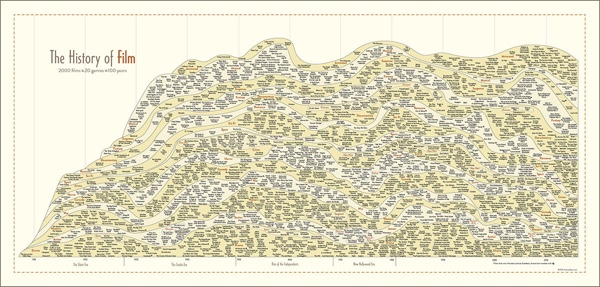
4. Zooming Infographics - The History of Film

Some infographic topics tackle a large amount of information, and a larger design is required to display all of its information. This infographic from Historyshots is a great example of a zooming infographic:

The History of Film

Source: http://www.historyshots.com/products/history-of-film

The History of Film plots out the most important films of the last 100 years into a beautiful, flowing timeline that visually separates the films into 20 different genres. As can be seen above, if this infographic was just left as a static image, it would be difficult to read everything because it is so detailed and complex. In the web browser, a large design is reduced in size so that the entire design can be viewed all at once on the screen, and the zooming controls are made available to the reader to view the small details clearly.


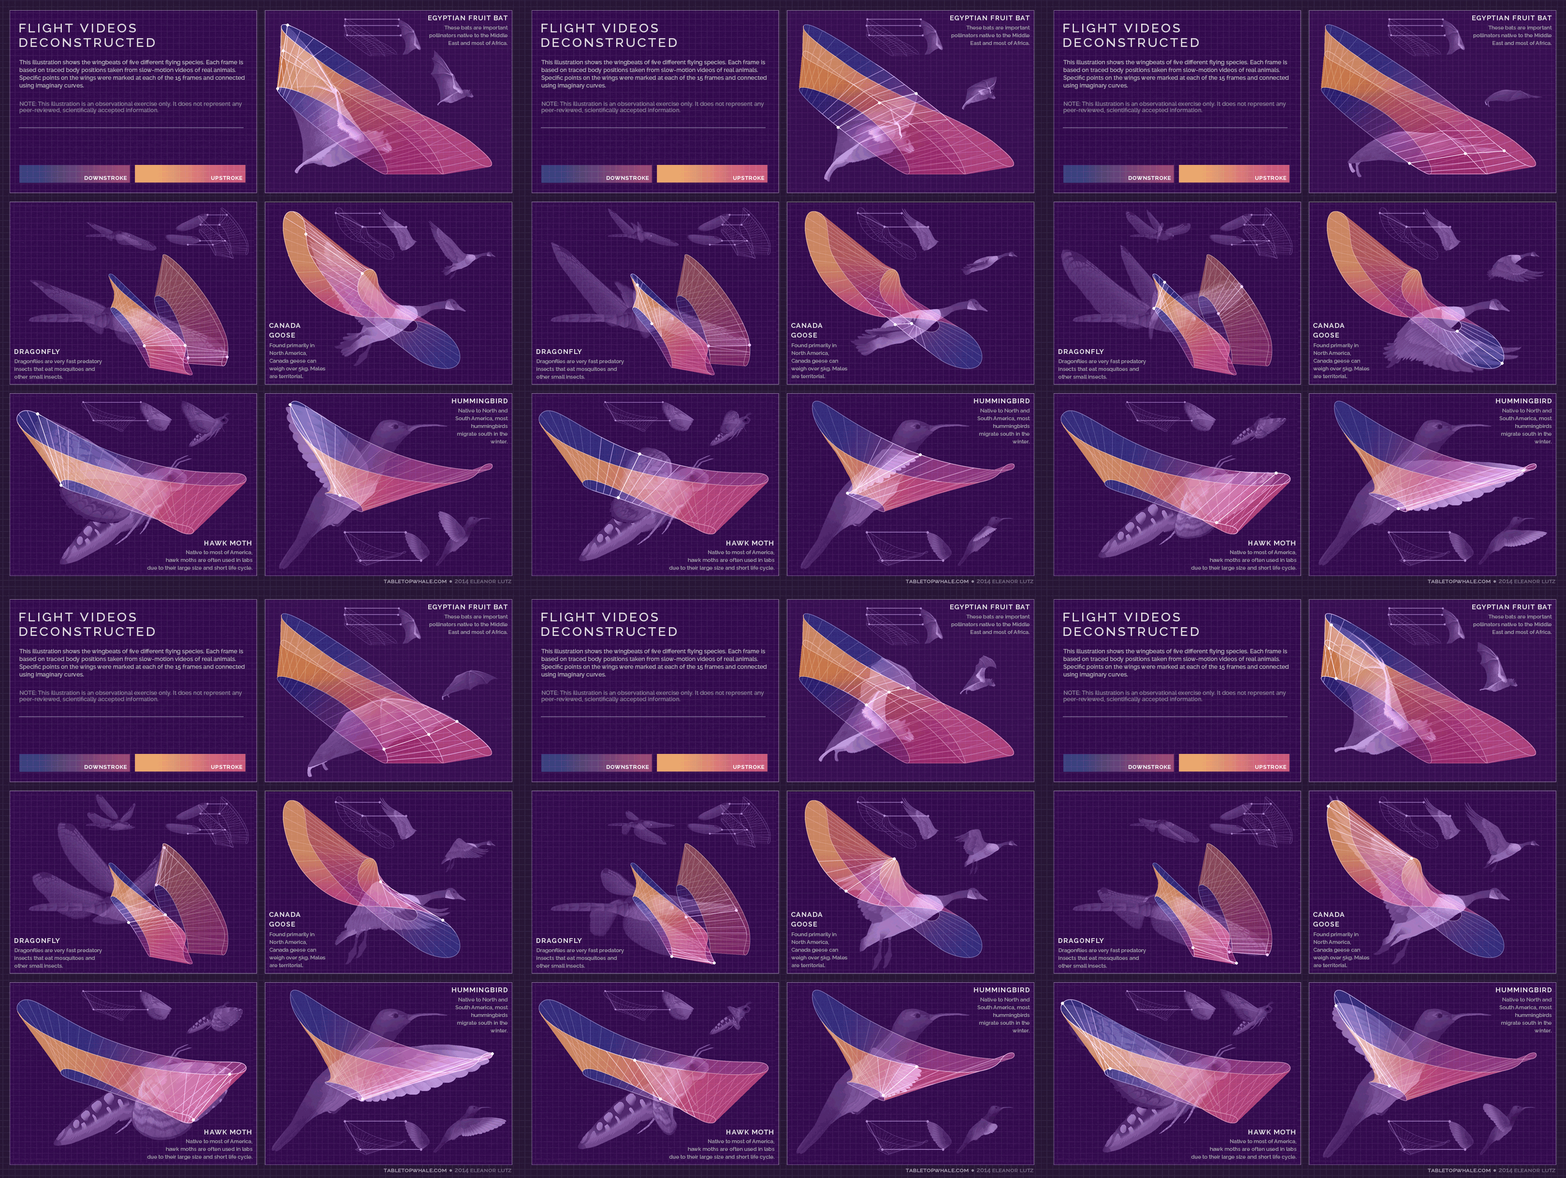
5. Animated Infographics - Flight Videos Deconstructed

Some topics for infographics are best created to feature motion, none more so than one that shows the the flight patterns of an Egyptian Fruit Bat, Dragonfly, Canada Goose, Hawk Moth, and Hummingbird. Flight Videos Deconstructed is an animated infographic about flight patterns within the animal kingdom. Covering five winged animals the and the motion their wings use while taking flight, this animated graphic uses vibrant colors and geometric shapes to convey the beauty and simplicity of flight.

Animated infographics create some motion or change in the design as the reader watches. It might be the bars in a bar chart growing, a color change, or (in the case of these winged animals) an animated character. These are differentiated from the video infographics because these are not video files. These are animated with HTML code or an animated GIF image file format to create the animation but can exist as a stand-alone object on a web page.


Flight Videos Deconstructed

Source: http://tabletopwhale.com/2014/09/29/flight-videos-deconstructed.html


With so many new and different formats of infographics available to today’s marketers, providing your audience with a story that conveys your message has never been more exciting. Sharing the key takeaways from your product or services can be done in an expertly designed way that appeals to your audience and leaves them wanting more. 

Tuesday
Sep032013

The Racial Dot Map

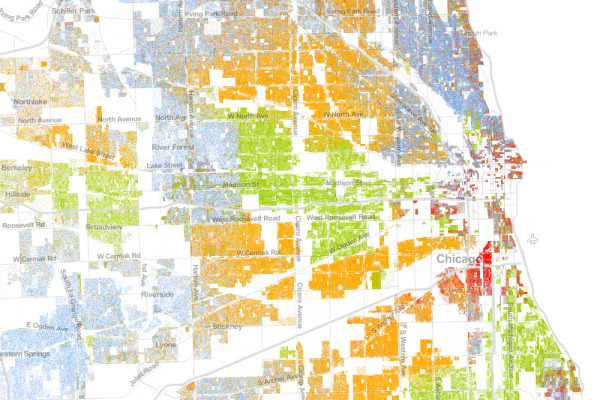
The Racial Dot Map Chicago

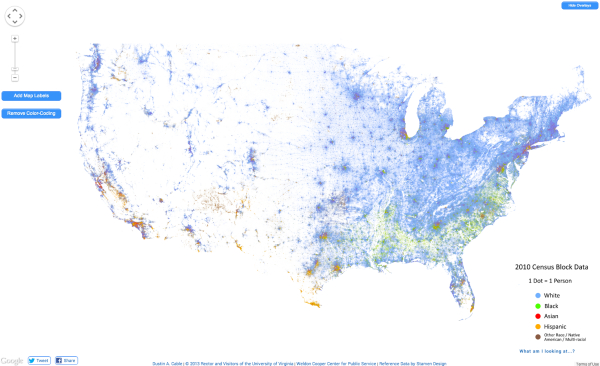
The Racial Dot Map visualizes the 2010 U.S. Census data, where every individual person is represented by a single, color-coded dot.  The color coding shows the racial groupings gathered by the census.

This map is an American snapshot; it provides an accessible visualization of geographic distribution, population density, and racial diversity of the American people in every neighborhood in the entire country. The map displays 308,745,538 dots, one for each person residing in the United States at the location they were counted during the 2010 Census. Each dot is color-coded by the individual’s race and ethnicity. The map is presented in both black and white and full color versions.

The map was created by Dustin Cable, a demographic researcher at the University of Virginia’s Weldon Cooper Center for Public Service. Brandon Martin-Anderson from the MIT Media Lab deserves credit for the original inspiration for the project. This map builds on his work by adding the Census Bureau’s racial data, and by correcting for mapping errors.

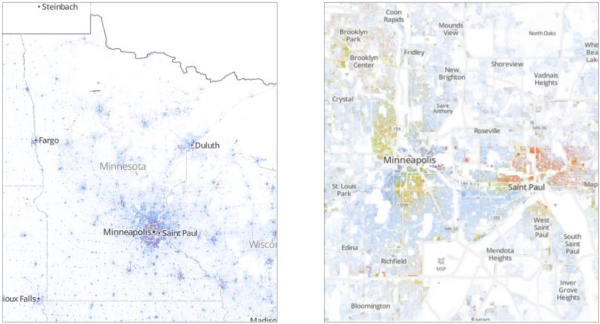
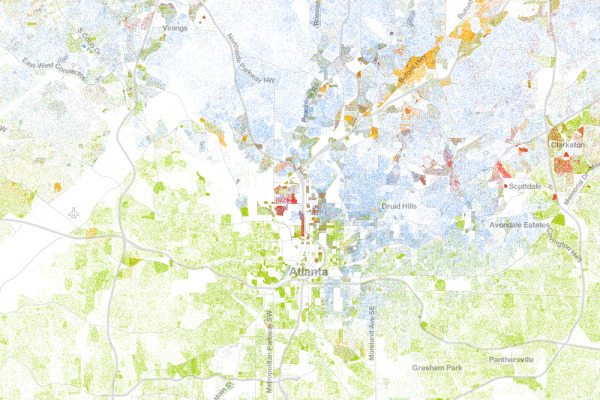
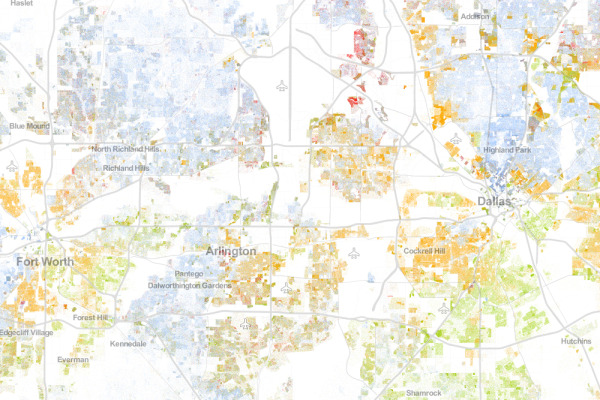
Each of the 308 million dots are smaller than a pixel on your computer screen at most zoom levels. Therefore, the “smudges” you see at the national and regional levels are actually aggregations of many individual dots. The dots themselves are only resolvable at the city and neighborhood zoom levels.

Each dot on the map is also color-coded by race and ethnicity. Whites are coded as blue; African-Americans, green; Asians, red; Hispanics, orange; and all other racial categories are coded as brown.

The map is an interactive, zoomable map online of the entire country, and allows you to explore any U.S. locations.  Chicago is show above.

Since the dots are smaller that screen resolutions where the viewer zooms out, the data is aggregated to pixels at each level of zoom.   The Minneapolis-St. Paul metro area is highlighted on the site as an example of the aggregation.  You can see the more detailed dot pattern on the right at the higher zoom level.

The Racial Dot Map Minneapolis

I would love to see this added as a layer in Google Earth!  Wouldn’t that be cool?

Thanks to Renee for sending in the link!  Also, found on Wired.

Atlanta:

The Racial Dot Map Atlanta


Dallas-Fort Worth:

The Racial Dot Map Dallas Fort Worth


The entire U.S.

The Racial Dot Map USA

Wednesday
Mar132013

Beautiful Animated Wind Maps

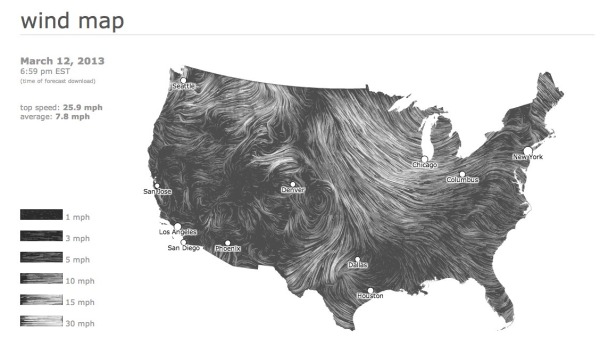
The static image above doesn’t do these maps justice.  Go see the Wind Map on the Hint.fm site to truly appreciate the design work from artists Fernanda Viégas and Martin Wattenberg.

An invisible, ancient source of energy surrounds us—energy that powered the first explorations of the world, and that may be a key to the future. This map shows you the delicate tracery of wind flowing over the US. 

The animation is mezmerizing, and the interactive piece allows you to click-to-zoom in closer to any part of the map to see much more detail in a specific region.  The main page shows the map based on the most current weather information, but the Gallery page has some snapshots linked to specific points in time (like Hurricane Sandy).  I love that even the speed legend on the side is animated!

You can also buy a poster version as an art print.

Thanks to Jeff Jarvis for sharing this on Google+!

Thursday
Jan062011

The 2010 Year in Review #infographic


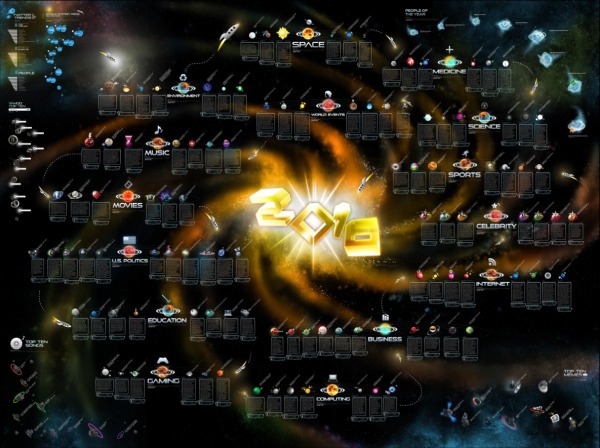
OnlineSchools.org has released the 2010 Year in Review zoomable infographic summarizing the major events of 2010.  The zoomable version is below, and it’s best viewed in full-screen million.

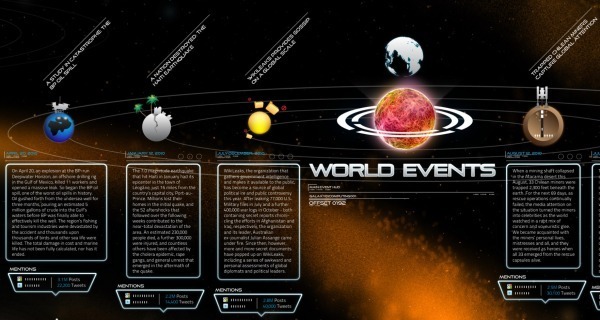
I have mixed feelings about this one.  Using the outer space metaphor, there are 15 major news categories with text descriptions of a handful of events in each.  Each event has a small celestial body illustration related to it, and a measure of blog posts and tweets on Twitter related to the event.


It really does need the zoomable feature, because the font sizes are dramatically different between the titles and the text.  That does make it difficult to read sometimes.  I noticed the Star Trek font used as well as part of the sections.

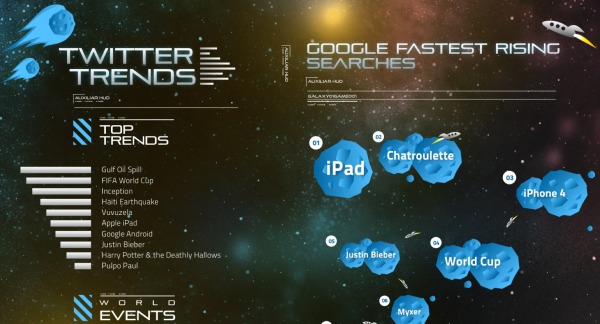
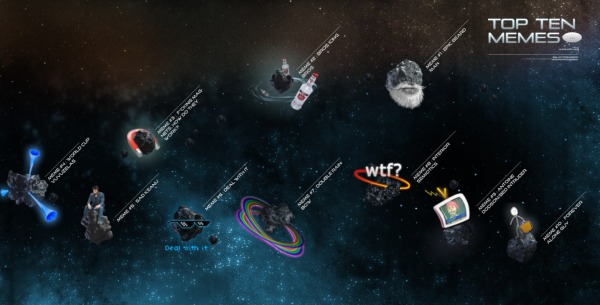
In the corners are some visualizations of things like Top Memes, Top Songs, Twitter Trends, Yahoo Searches and Google’s Fastest Rising Searches.


I think this one is missing good sources for where their information came from, a designer listing, some of the text s too small and in some cases is more illustration then infographic.  Overall it’s fun to zoom around and appreciate the details they’ve included.

Thanks Brittany!


Thursday
Jun242010

Adobe Actionscript 3.0 Poster Viewer

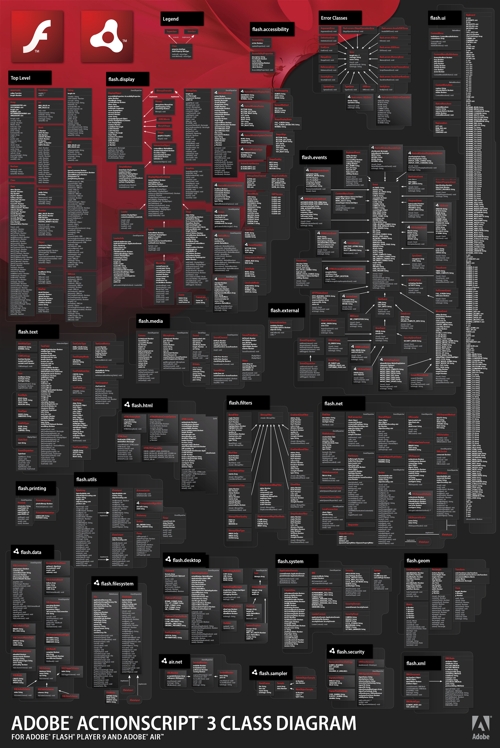
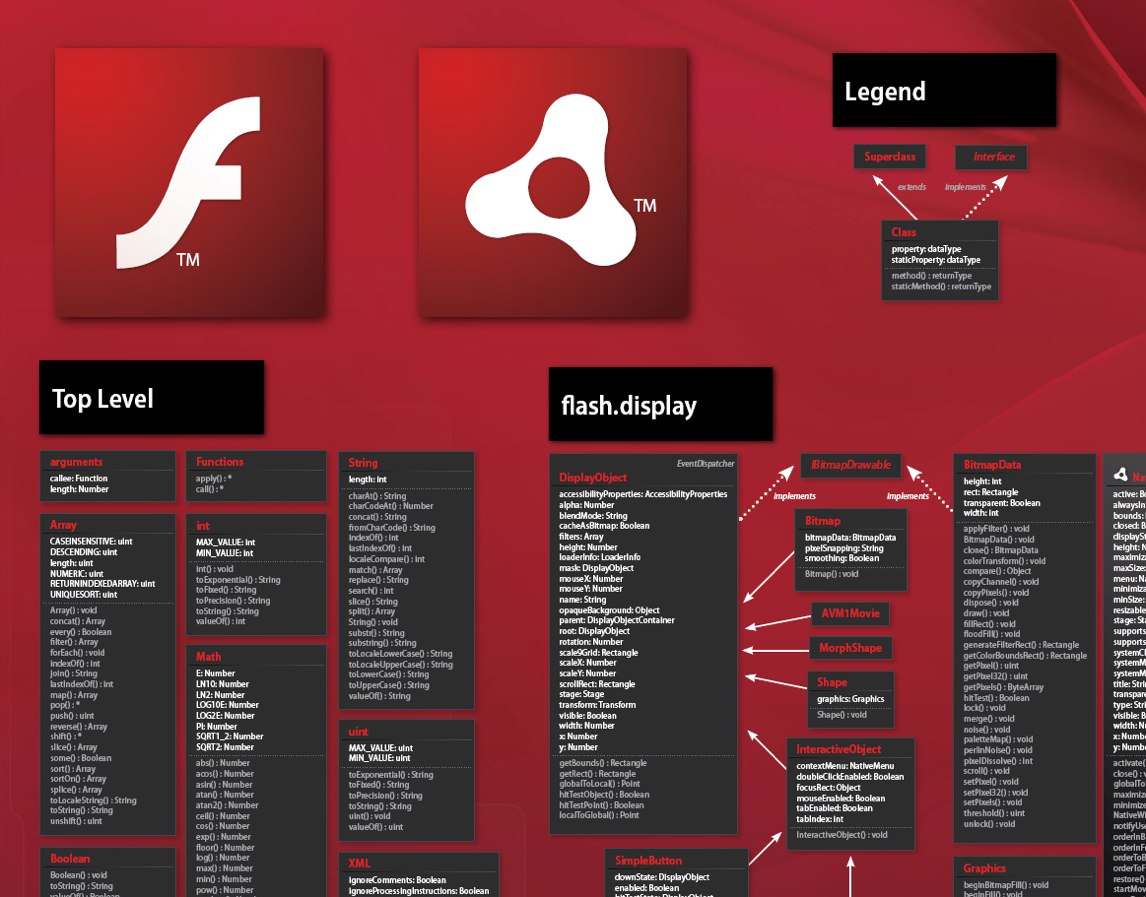
Adobe has published posters like this one before for registered users of their different software packages.  Now you can download the ActionScript 3.0 Diagram Viewer, a zoomable version using Adobe AIR.  This can keep a stand-alone viewer on your desktop (or 2nd monitor) as a reference when you need it.  For some developers, this may be easier than viewing the high-resolution JPG.

With the excellent feature from Zoomify, and the nicely laid out AS 3.0 posters, you are able to zoom and navigate through the entire Flash and Adobe® AIR™ ActionScript 3.0 API.

The AIR app was designed by ShaneHoffa.

Thanks to Julz for the link!