EARTH, a visualization project
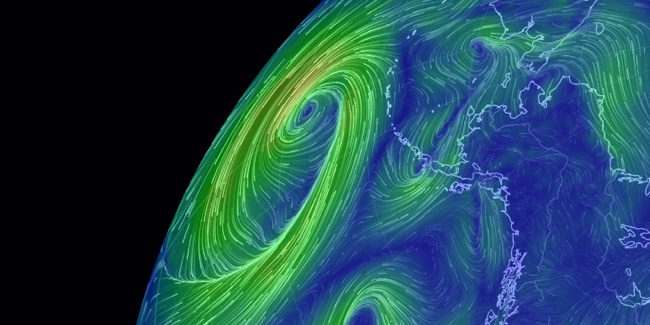
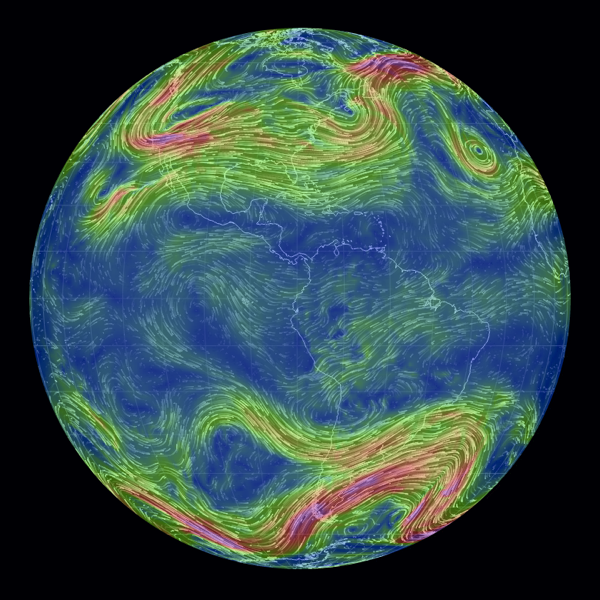
EARTH, by Cameron Beccario, is a beautiful interactive, animated visualization of a few different weather features across the entire globe.
EARTH, by Cameron Beccario, is a near real-time visualization of global weather conditions forecast by supercomputers. This vivid capture depicts intricate, dramatic swirling patterns of wind streamlines reminiscent of oil paintings of the Impressionists.
CAMERON BECCARIO'S creation, Earth. depicts wind patterns on a global scale. The artist began with a wind map of Tokyo, where he lives, and then he took on the world. You can see his animated creation at earth.nullschool.net.
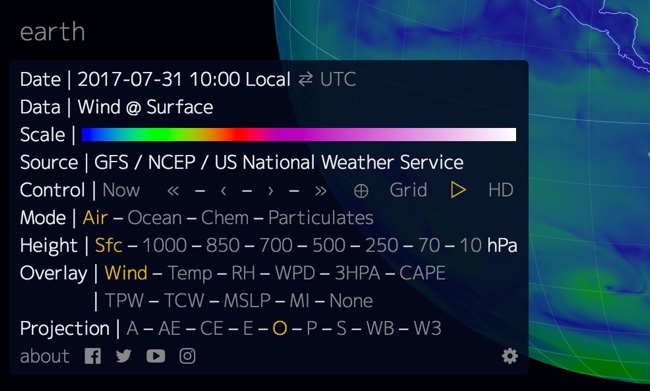
You can spin the globe and zoom in on any area in the World. Opening the setting panel lets you change the data that is being displayed; from wind to ocean waves to particulates in the atmosphere.
To support his project, you can purchase prints of some of the high-resolution images from Point.B Studio
Designed in D3, all of the source code is also available at https://github.com/cambecc/earth. Of course the project was inspired by the Wind Maps visualization by Fernanda Viégas and Martin Wattenberg, that I have posted about before.


 Randy
Randy


