About
Randy Krum
President of InfoNewt.
Data Visualization and Infographic Design

Infographic Design

Infographics Design | Presentations
Consulting | Data Visualizations

DFW DataViz Meetup

Join the DFW Data Visualization and Infographics Meetup Group if you're in the Dallas/Fort Worth area!

Search the Cool Infographics site

Custom Search

Subscriptions:


Feedburner

The Cool Infographics® Gallery:

How to add the
Cool Infographics button to your:

Cool Infographics iOS icon

- iPhone
- iPad
- iPod Touch


Read on Flipboard for iPad and iPhone

Featured in the Tech & Science category

Flipboard icon

Twitter Feed
From the Bookstore

Caffeine Poster

The Caffeine Poster infographic

Entries in network map (3)

Wednesday
Mar292017

Iconography of Ink

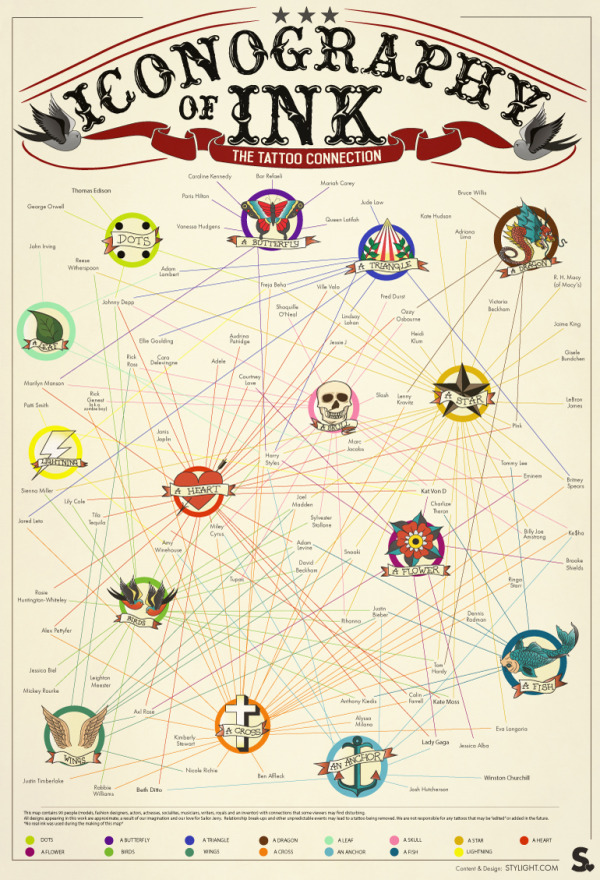
Iconography of Ink infographic

Iconography of Ink, created by Stylight.com, maps out 90 celebrity tattoos and their connections to one another. You can find other interesting facts and tips about tattoos at Stylight.com.

Tattoos—originating from the Tahitian word ‘tatau’—have decorated the skins of endless cultures, spanning thousands of years. Both Polynesian tribes and Italian monks donned such skin art, not to mention, world-traveling sailors and European monarchs.

Fast-forward to today and tattoos are common practice amongst all socioeconomic classes. Scan PopSugar, Huffington Post or Vogue magazine and you’re sure to find tattooed musicians, actors and models alike. The celebrity tattoo craze isn’t just a sign of the times, but an entertaining melodrama.

From bad ass Cambodian tigers (read: Angelina Jolie) to ill-advised dedications to spouses (we’re looking at you Melanie Griffith), watching the evolution of Hollywood tattoos rivals even the most absorbing of reality tv shows.

Thanks to Elisa for sending in the link!

Friday
Oct142016

A House Divided: The Rise of Political Partisanship

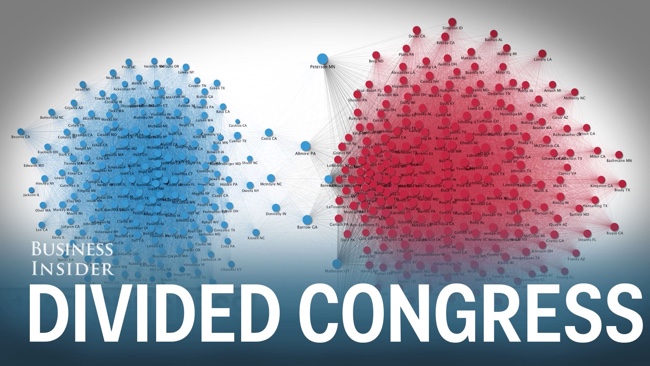
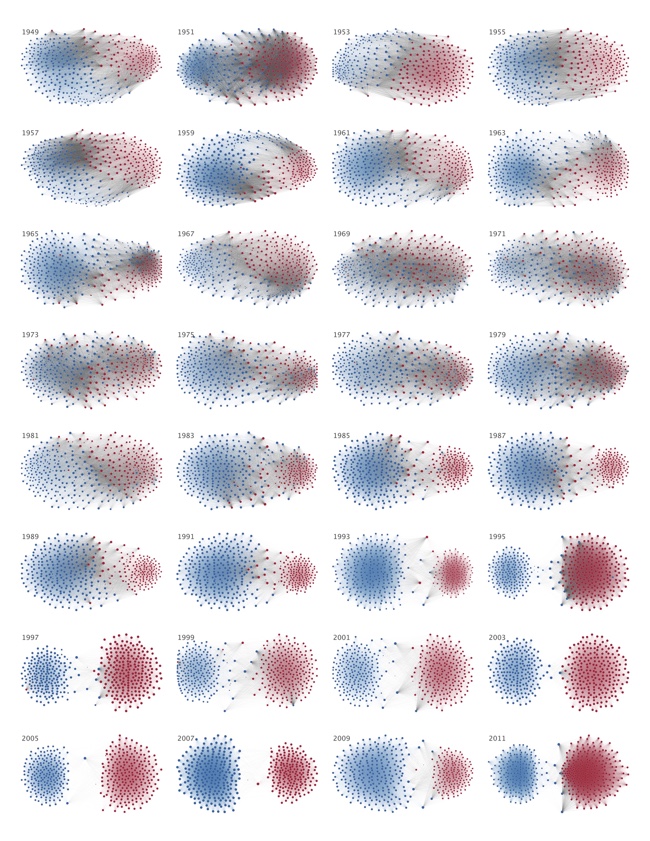
The Rise of Partisanship in the House of Representatives is a video infographic showing network maps and animating their change over time. Business Insider published this great data visualization video earlier this year.


This 60-second animation shows how divided Congress has become over the last 60 years

It's news to no one that Congress has had a hard time passing legislation in recent years. Some have even asserted that partisanship in Washington has reached historic levels. But how do we put the current divide in perspective? A group of researchers recently tried to quantify and visualize House partisanship in a paper published in PLoS ONE.

Produced by Alex Kuzoian. Original visualization by Mauro Martino.

To understand what is being displayed:

  • Each dot represents a member of the U.S. House of Representatives
  • Connection lines represent when two members voted the same way
  • Connection line thickness represents how often they voted together during each 2-year period
  • Dot size based on the total number of connections
  • Color represents political party

A poster version of this design is also available on Mauro Martino's site:

Thanks to Sue Miller for sharing on Facebook!

Tuesday
Sep202016

The Mostly Complete Chart of Neural Networks

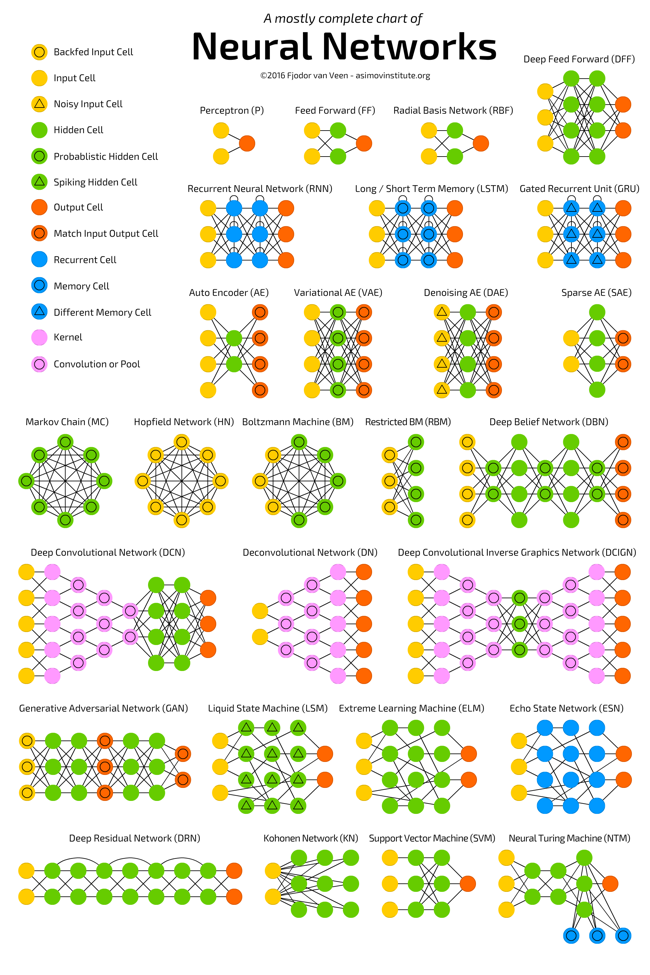
The Mostly Complete Chart of Neural Networks infographic

The Mostly Complete Chart of Neural Networks by the team at the Asimov Institute

With new neural network architectures popping up every now and then, it’s hard to keep track of them all. Knowing all the abbreviations being thrown around (DCIGN, BiLSTM, DCGAN, anyone?) can be a bit overwhelming at first.

So I decided to compose a cheat sheet containing many of those architectures. Most of these are neural networks, some are completely different beasts. Though all of these architectures are presented as novel and unique, when I drew the node structures… their underlying relations started to make more sense.

One problem with drawing them as node maps: it doesn’t really show how they’re used. For example, variational autoencoders (VAE) may look just like autoencoders (AE), but the training process is actually quite different. The use-cases for trained networks differ even more, because VAEs are generators, where you insert noise to get a new sample. AEs, simply map whatever they get as input to the closest training sample they “remember”. I should add that this overview is in no way clarifying how each of the different node types work internally (but that’s a topic for another day).

Composing a complete list is practically impossible, as new architectures are invented all the time. Even if published it can still be quite challenging to find them even if you’re looking for them, or sometimes you just overlook some. So while this list may provide you with some insights into the world of AI, please, by no means take this list for being comprehensive; especially if you read this post long after it was written.

High-res poster image version is also available.