About
Randy Krum
President of InfoNewt.
Data Visualization and Infographic Design

Infographic Design

Infographics Design | Presentations
Consulting | Data Visualizations

DFW DataViz Meetup

Join the DFW Data Visualization and Infographics Meetup Group if you're in the Dallas/Fort Worth area!

Search the Cool Infographics site

Custom Search

Subscriptions:


Feedburner

The Cool Infographics® Gallery:

How to add the
Cool Infographics button to your:

Cool Infographics iOS icon

- iPhone
- iPad
- iPod Touch


Read on Flipboard for iPad and iPhone

Featured in the Tech & Science category

Flipboard icon

Twitter Feed
From the Bookstore

Caffeine Poster

The Caffeine Poster infographic

Entries in Congress (3)

Friday
Oct142016

A House Divided: The Rise of Political Partisanship

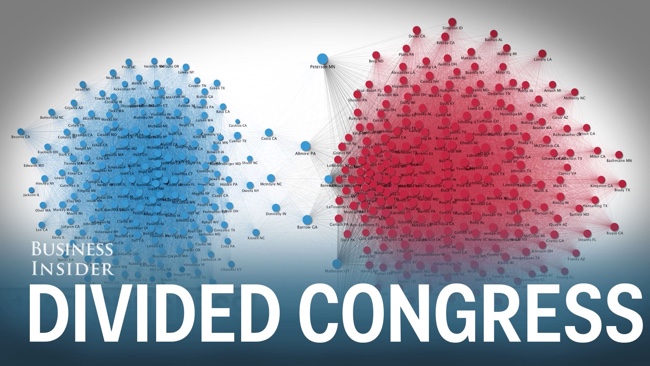
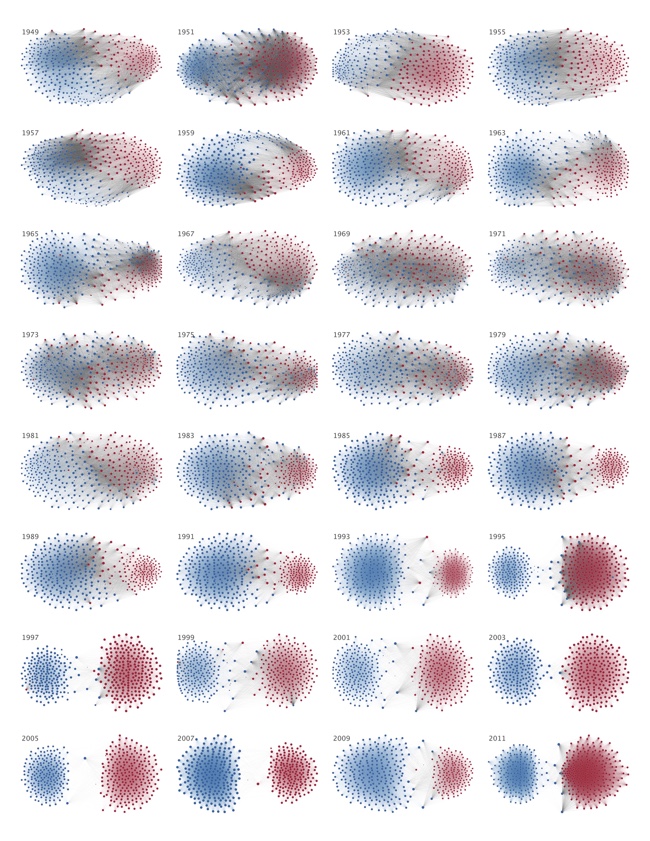
The Rise of Partisanship in the House of Representatives is a video infographic showing network maps and animating their change over time. Business Insider published this great data visualization video earlier this year.


This 60-second animation shows how divided Congress has become over the last 60 years

It's news to no one that Congress has had a hard time passing legislation in recent years. Some have even asserted that partisanship in Washington has reached historic levels. But how do we put the current divide in perspective? A group of researchers recently tried to quantify and visualize House partisanship in a paper published in PLoS ONE.

Produced by Alex Kuzoian. Original visualization by Mauro Martino.

To understand what is being displayed:

  • Each dot represents a member of the U.S. House of Representatives
  • Connection lines represent when two members voted the same way
  • Connection line thickness represents how often they voted together during each 2-year period
  • Dot size based on the total number of connections
  • Color represents political party

A poster version of this design is also available on Mauro Martino's site:

Thanks to Sue Miller for sharing on Facebook!

Thursday
Jun052014

Legislative Explorer: Watch Government In Action

Legislative Explorer: Watch Government In Action

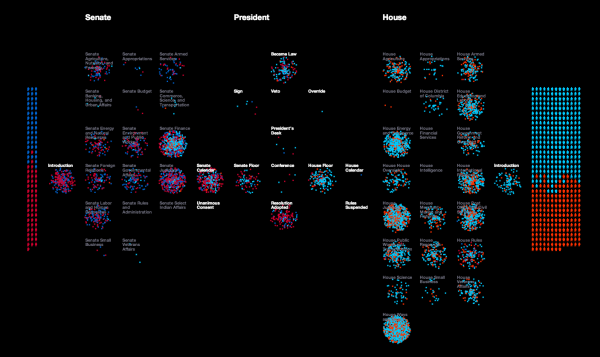
Legislative Explorer is an interactive, animated data visualization that visualizes the process of bills submitted by houses of Congress; the Senate on the left and the House of Representatives on the right.  Designed by Researchers at the University of Washington’s Center for American Politics and Public Policy, it’s a fascinating visualization that is mesmerizing to watch.

A deluge of data is challenging scientific researchers across disciplines to develop new techniques for detecting patterns in large and complex datasets. This general area of research is known as data-driven discovery, or ‘D3.’ Visualizations are a particularly important area of innovation because they help researchers to investigate complex processes at a more holistic level. The goal of Legislative Explorer is to leverage the same benefits of data-driven visualizations to advance understanding of government.

A more in-depth discussion of Legislative Explorer with multiple animations and videos is available at the Center for American Politics and Public Policy.

Anyone can use Legislative Explorer to observe large scale patterns and trends in congressional lawmaking without advanced methodological training. In addition, anyone can dive deeper into the data to further explore a pattern they’ve detected, to learn about the activities of an individual lawmaker, or to follow the progress of a specific bill. Start Exploring!

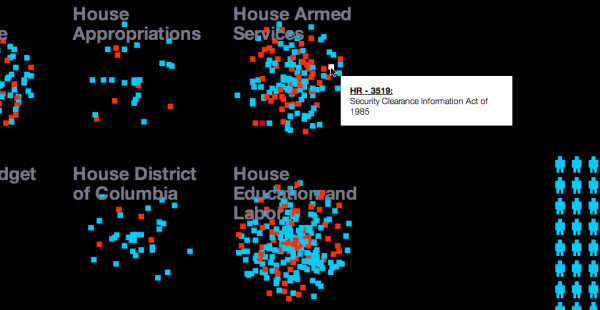
I selected the 99th Congress (1985-1986) for the screenshots, and you can see the party breakdown of both houses of Congress by their color.  Each icon represents a specific member of Congress which you can identify by hovering your mouse over the icon.  The animation will show a visual spray of bills introduced by members in both houses of Congress as party-color-coded dots that move into committees and through the steps to becoming a law.

Legislative Explorer: Watch Government In Action Zoom 

There are a number of user-definable filters to help narrow down the visualization to a specific party, only one committee, or even just to watching a single bill move through the proces.

Here’s a quick video tutorial:

Found on FlowingData

Tuesday
Feb052013

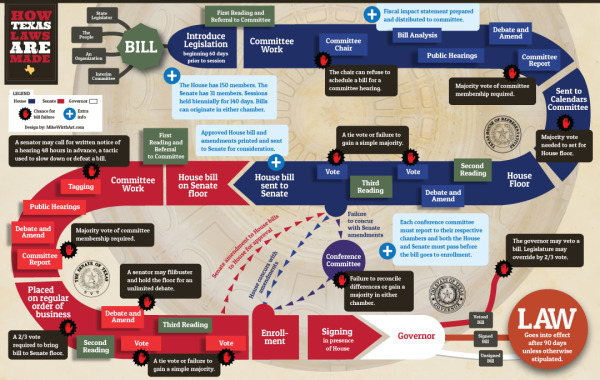
How Texas Laws Are Made

How Texas Laws Are Made infographic

Texas Co-Op Power brings us the How Texas Laws Are Made infographic outlining the process bills go through in the state legislature to become the law of the land.  Also available as a PDF for download here.

The 83rd session of the Texas Legislature—150 representatives and 31 senators—is under way. What transpires over the 140-day session that began January 8 may seem incomprehensibly complex to the average citizen. So, in the interest of keeping our co-op members informed and involved, we offer this compact guide to how a bill moves through the legislative process and reasons why communication with your legislators matters.

Designed by Mike Wirth Art with Suzanne Cooper-Guasco, Ph.D., this infographic uses a game-board design style to online all of the steps along the path.  The color-coding to differentiate the activities between the House, the Senate and the Governor is clear and easy to understand.