About
Randy Krum
President of InfoNewt.
Data Visualization and Infographic Design

Infographic Design

Infographics Design | Presentations
Consulting | Data Visualizations

DFW DataViz Meetup

Join the DFW Data Visualization and Infographics Meetup Group if you're in the Dallas/Fort Worth area!

Search the Cool Infographics site

Custom Search

Subscriptions:


Feedburner

The Cool Infographics® Gallery:

How to add the
Cool Infographics button to your:

Cool Infographics iOS icon

- iPhone
- iPad
- iPod Touch


Read on Flipboard for iPad and iPhone

Featured in the Tech & Science category

Flipboard icon

Twitter Feed
From the Bookstore

Caffeine Poster

The Caffeine Poster infographic

Entries in water (22)

Monday
May102010

BP Oil Relief Plan Infographic

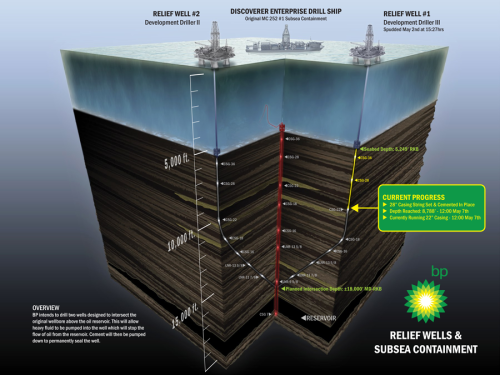
BP has released this infographic, Relief Wells & Subsea Containment, showing how they plan to seal the oil well leak in the Gulf of Mexico, and the current progress at 8,788ft.

British Petroleum intends to drill two wells designed to intersect the original wellbore above the oil reservoir. This will allow heavy fluid to be pumped into the well which will stop the flow of oil from the reservoir. Cement will then be pumped down to permanently seal the well.

BP needs to cement 7 casings into place before the relief well can intersect with the main drill pipe which is pouring approximately 5,000 barrels of oil per day into the ocean. They have completed 3 casings, with 4 remaining. They have reached a drill depth of just below 10,000 feet, with another 8,000 feet remaining. At about 12,000 feet they will begin angling toward the center of the damaged oil pipe.

BP has estimated that the project will require 90 days to complete the first relief well.

Original post on HollywoodBackstage.com, found on VizWorld.com

Monday
Apr122010

Diving the Depths - a really deep infographic

I love how this infographic, Diving the Depths, defies the standard paper or poster size to get it’s message across.  I’m really not a fan of the recent trend towards really tall infographics without purpose, but here the tall banner style actually conveys meaning.  Infographic designed by Big Oak Studios.

Found on Infographics Showcase, a great site that also highlights some of the best infographics from the web.

Thanks to Shell for the link!

Monday
Jan182010

Mega Shark infographic


I love it when someone just decides to create their own infographic.  Stivo (Stephen Taubman) created this Mega Shark infographic to demonstrate the physics behind a giant shark taking down a commercial jet airplane in the movie Mega Shark vs. Giant Octopus.

Last year, I discovered the wonderfully cheezy and sharky movie: Mega Shark Vs. Giant Octopus. While it certainly appealed to a more straight-to-DVD niche market of creature-feature enthusiasts, it wasn’t half bad. Pretty laughable in parts…well actually, in most parts when you consider the wooden acting and crap computer animation. However the most ridiculous scene has to be when Mega Shark takes down a commercial jetliner that is cruising over the middle of the ocean. It was this moment that took the movie from being a little ho-hum to “holy shit, did that shark just eat a plane!?”. Check out the clip for yourself on youtube here.

It’s pretty incredible when you think about it. I mean, how the hell did it do that? What would it require for a shark the size of a plane to launch itself out of the water and take down a moving aircraft? After reviewing some of my basic physics calculations (thanks SUVAT!) I came up with some pretty startling figures. However, it didn’t feel like I would be doing such an epic event justice with just a basic blog post, which meant it was time to do what I love most: an infographic! I had been itching to do one for a while now, and this seemed like the perfect opportunity. So with all that said, check out the resulting design below. Oh, and just click on the image to download the full size PDF version for the smaller details.


Great job Stivo!

Tuesday
Jun022009

Déjà Poo: The Living Machine Sewage System


I saw that Nathan posted this one over on FlowingData this morning, and I had to share.  This is from a Wired article on howusing the plants in the lobby of an office building can help treat the sewage generated.

Tuesday
May052009

Effing Hail, The isometric infographic game!


"Effing Hail" is a cool web game you play in your browser from Intuition Games!  The isometric animation is very reminiscent of the Royskopp video for "Remind Me".  You control the wind to hold the hail in the air so it continues to grow in size before releasing it to crush the objects below.

Found on Information Aesthetics and a bunch of Tweets on Twitter!

Thursday
Oct302008

The Future of Food


Wired magazine has a great series of nine infographics from the November issue about the world's food supply problems.
Forty years ago, advances in fertilizers and pesticides boosted crop yield and fed a growing planet. Today, demand for food fueled by rises in worldwide consumption of meat and protein is again outpacing farmers ability to keep up. It's time for the next Green Revolution.
Thanks for the link Ethel!  Here are a few more.  Check them all out on Wired.com.


Thursday
Oct092008

Watercube, The Book


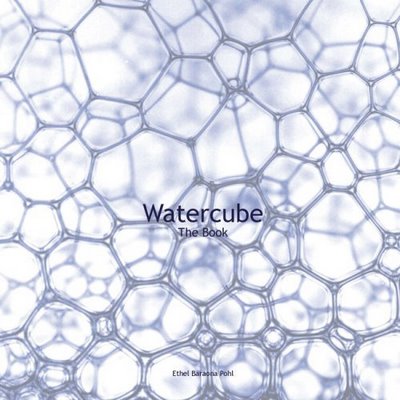
Watercube, is a new book by Ethel Baraona Pohl.  The book is about the National Aquatics Centre built in Beijing for the 2008 Olympics, and has some cool infographics inside.  Some of the graphics were contributed by architect César Reyes Nájera.  A review of the book can be found here on www.v2com.biz
WATERCUBE: The Book is a complete monographic publication about the National Swimming Center for the Beijing Olympics 2008. With an exhaustive description about the Watercube we present a detailed study of the project. The book makes an holistic approach to the project that starts with a brief description of urban and social changes that China has been experienced in the last decade. These facts have encouraged the construction boom that made possible these kind of projects occur in cities like Beijing.

 
This page compared the amount of steel used to built the Watercube to some of the most well known buildings around the world.
This page shows a comparison to the same set of buildings around the world, but shows the tons of CO2 produced due to the steel used in their construction.


This page is one of the years of the timeline leading up to the construction of the Watercube.

Here you can buy Watercube, by Ethel Baraona Pohl, on Amazon.com.

Special thanks to Ethel for sharing the images from her book, and allowing me to post them on Cool Infographics!

Saturday
Sep202008

Points Of View


This is a new t-shirt from Despair.com.  If you're not familiar with Despair, they are the opposite of Successories, the company that produces motivational posters.  I'm a big fan of their humor, and I loved the new shirt design.

Tuesday
Jul082008

The Internet's Undersea World

An infographic map from the The Guardian in the UK, a map showing the few underwater cables that connect the world.

Found on digg.com

Friday
Jun272008

Big Blue Marble: Water and Air

Found on infosthetics.com, phiffer.com and boingboing.net

Global water and air volume. Conceptual computer artwork of the total volume of water on Earth (left) and of air in the Earth's atmosphere (right) shown as spheres (blue and pink). The spheres show how finite water and air supplies are. The water sphere measures 1390 kilometers across and has a volume of 1.4 billion cubic kilometers. This includes all the water in the oceans, seas, ice caps, lakes and rivers as well as ground water, and that in the atmosphere. The air sphere measures 1999 kilometers across and weighs 5140 trillion tonnes. As the atmosphere extends from Earth it becomes less dense. Half of the air lies within the first 5 kilometers of the atmosphere.

Credit: Adam Nieman / Photo Researchers, Inc

I'd love to see one more showing all of the oil in the world.

The original appears to be here at PhotoResearchers.com