About
Randy Krum
President of InfoNewt.
Data Visualization and Infographic Design

Infographic Design

Infographics Design | Presentations
Consulting | Data Visualizations

DFW DataViz Meetup

Join the DFW Data Visualization and Infographics Meetup Group if you're in the Dallas/Fort Worth area!

Search the Cool Infographics site

Custom Search

Subscriptions:


Feedburner

The Cool Infographics® Gallery:

How to add the
Cool Infographics button to your:

Cool Infographics iOS icon

- iPhone
- iPad
- iPod Touch


Read on Flipboard for iPad and iPhone

Featured in the Tech & Science category

Flipboard icon

Twitter Feed
From the Bookstore

Caffeine Poster

The Caffeine Poster infographic

Entries in charity (7)

Friday
Aug292014

False Visualizations: Sizing Circles in Infographics

Accuracy is the most important aspect of an infographic design!

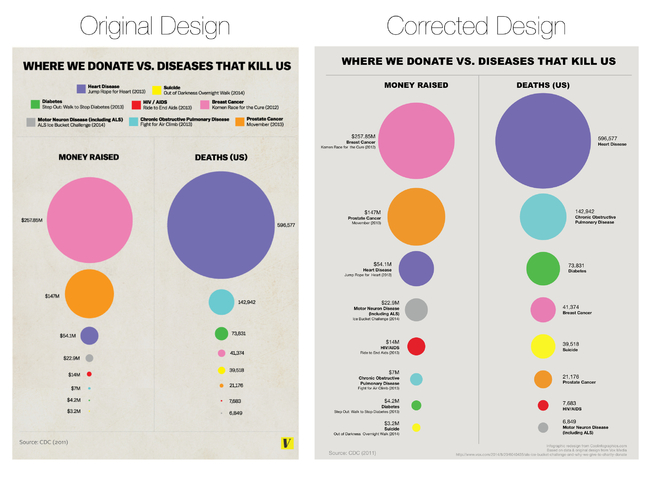
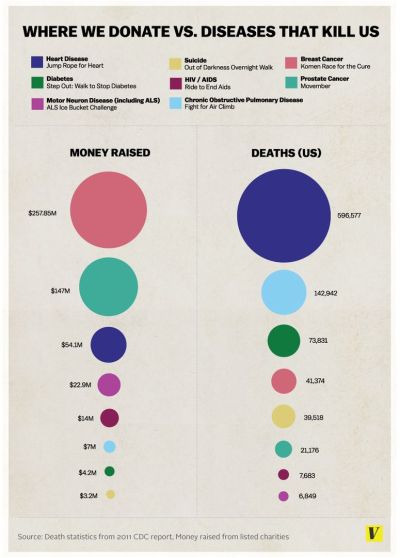
Last week, the article The Truth about the Ice Bucket Challenge by Julia Belluz on Vox Media included the infographic, Where We Donate vs. Diseases That Kill Us, that used proportionally sized circles as its data visualization. The problem with this design is that the circle sizes don’t match the values shown. This is a false visualization and significantly over exaggerates the smaller amounts of money contributed to each charity and the deaths attributed to each cause.

This causes problems because readers often just look at the visuals without reading the actual numbers. They start with the assumption that a visualization accurately represents the data. The Vox Media story and infographic already have over 12,000 shares on Facebook, and this is a great case study for designers to understand how important it is to visualize data accurately.

As readers, we see the area of two-dimensional shapes on the page to represent the different values, but design software only allows width and height adjustments to size shapes. Designers make the mistake of adjusting the diameter of circles to match the data instead of the area, which incorrectly sizes the circles dramatically. It takes some geometry calculations in a spreadsheet to find the areas and then calculate the appropriate diameters for each circle. To demonstrate, I created this corrected version of the infographic.

False Visualizations: Sizing Circles in Infographics Revised

My Google Docs spreadsheet of the correct circle area and diameter calculations is available here.

Assuming this was a design mistake, and there was no intent to deceive the audience, this is a common mistake that many designers make.  So many designers, that I included an entire section on this topic in the Cool Infographics book to help designers understand how to size the area of circles.

I made one other improvement to the corrected design above by removing the color legend and listing the charities and causes of death right next to the appropriate circles. This makes the whole visualization easier for the audience to read by eliminating the need to look back-and-forth from the circles to the color legend to figure out what each circle represents.  Placing the text next to each circle keeps the information in the reader’s field of view which minimizes eye movement.

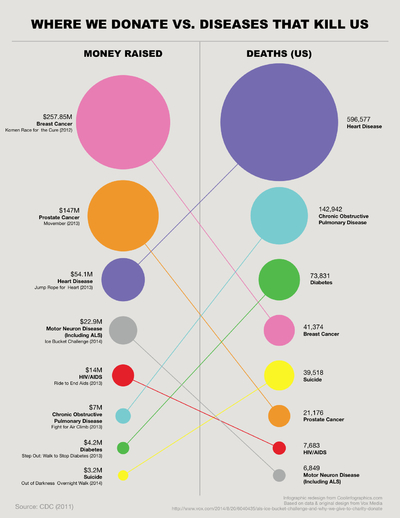
Sticking with the circles data visualization style, I wanted to take the design a little bit further. I would recommend one of two alternate improvements.  First, adding colored connecting lines is one way to make it easier for the audience to find the related circles in the columns sorted in descending order.

False Visualizations: Sizing Circles in Infographics Revised Lines

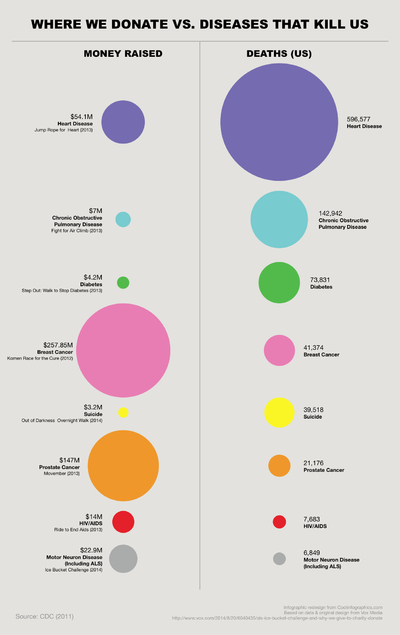
A second alternative would be to sort the lists to line up the related circles.  This makes it much easier for the audience to see the direct comparisons between charitable contributions and death rates related to the same cause.

False Visualizations: Sizing Circles in Infographics Revised Descending Sort

I’m passing over any discussion about whether using proportionally sized circles (a bubble chart) is the best visualization method for this data. If a designer makes the choice to use sized shapes, my point is that the data visualizations in the infographic must match the numbers using area.  David Mendoza published a good analysis worth reading and designed an alternative way to visualize the data in his article, This Bubble Chart Is Killing Me.

How else would you improve this design?

NOTE: I was able to contact the designer who created the infographic at Vox Media, and he had already realized his error after the infographic had been published. As I had guessed, he had mistakenly adjusted the diameter of the circles instead of the area. He told me that he’s working on updating the official infographic design in the article, but it hasn’t been published on the Vox Media site yet.


Monday
Jul082013

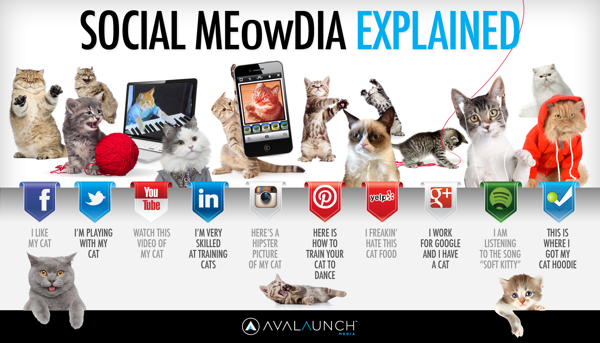
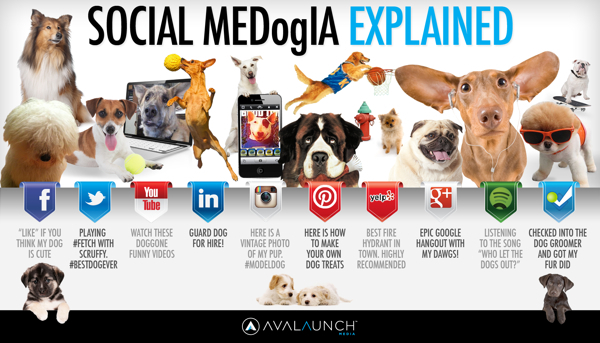
Paws vs. Claws: Social Media Explained

Social Media Explained Cat infographic


Avalaunch Media is running the Paws vs. Claws infographic voting competition between these two infographic that explain the social media networks from the perspective of dogs and cats.  The campaign is raising money for charity, so place your vote now (before July 31st) and donate money if you are in a position to support the causes.

A Social Media Bark-off of Epic Purrportions!

Here’s how it works:

We’ve joined forces with two world-renowned, animal-focused, non-profit organizations — The Humane Society of The United States is being sponsored by the Claws (a.k.a cats) and NEADS/Dogs for Deaf and Disabled Americans is being sponsored by the Paws (a.k.a. dogs).

We’re inviting internet-and-animal-loving companies and individuals everywhere to join us in donating to a pot of charity-cash. We’re kicking off the sharing by pledging $500 to the to-be-determined winner of the Paws vs Claws showdown and we’re counting on you, our internet-and-animal loving friends, to join in donating to the charitable cause.

Social Media Explained Dog infographic


 Thanks to Matt for sending in the link!


Thursday
May022013

Connecting The Dots

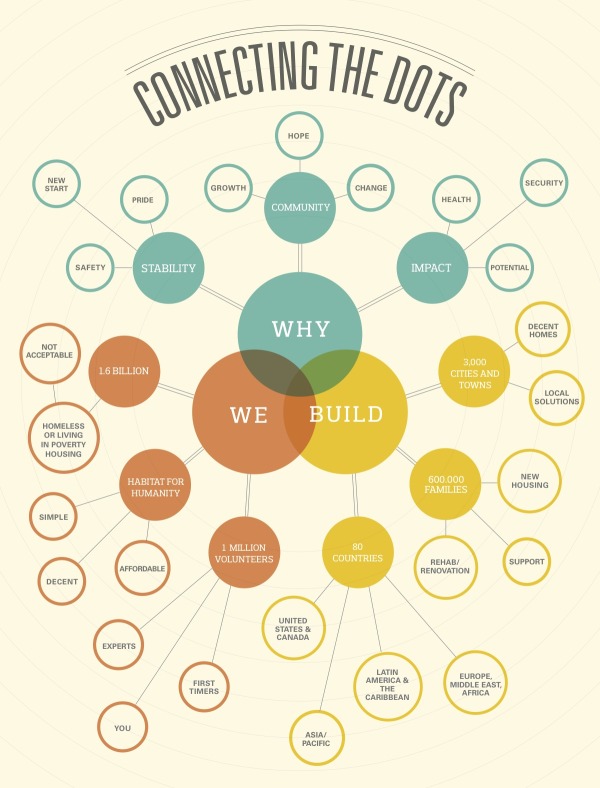
Connecting The Dots infographic Habitat for Humanity

Connecting the Dots is a mind map design from Habitat for Humanity.  It was published in the May 2013 edition of their own magazine, Habitat World, and made available online as a PDF download.

Learn more about how Habitat builds homes, communities and hope.

I really like the combination of the Venn diagram in the center and the mind map nodes that extend outward.  The sizes of the circles doesn’t have any meaning, just sized to fit the text.  This is a really good way for Habitat for Humanity to tell their story with a visual explanation.


Monday
Dec312012

Water Changes Everything

I have heard it argued that clean water has been the single greatest medical advancement in mankind’s history.  With effects including longer lifespan, reducing diseases, reducing birth defects and generally improving health, it’s easy to undertand how important clean water is.  Water Changes Everything is an infographic promotional for the Charity Water organization.

I’ve started the “Start 2013 Clean” campaign to raise $1,000 for Charity Water from Cool Infographics readers.  Start off 2013 right, and help me support making the world a better place.

Almost a billion people live without clean drinking water. We call this the water crisis. It’s a crisis because it only starts with water — but water affects everything in life.

Health. Education. Food security. And the lives of women and children, especially.

We can end the water crisis in our lifetime. But first we have to let everyone know it’s happening. Learn how water changes everything — and share this with everyone you know. 

It was an infographic map design by John Snow in 1854 that led to the discovery that a cholera outbreak in Soho, London was geographically tied to the location of a water well.  At the time, the popular belief was that cholera was airborne, and people would become sick by breathing “bad air.”  But John Snow’s early data visualization of reported cases was used to convince local officals to shut down the potentially contaminated well (by removing the handle).  This action is commonly credited with ending the epidemic.

Original map made by John Snow in 1854. Cholera cases are highlighted in black.

Video was designed by Jonathan Jarvis, who also designed the Crisis of Credit infographic video, and the voiceover is Kristen Bell.

Found on Daily Infographic and FastCoDesign

Friday
Sep302011

A Disaster for FEMA

The team at DigitalSurgeons has taken it upon themselves to design the FEMA on Warning Watch infographic that looks at how 2011 (through Spetember 14th) is draining all of the FEMA funds.

We’re obsessed with data and showcasing it in a way that anyone can digest. This was unsolicited by anyone, and we just wanted to raise awareness for how much of a reality FEMA exceeding their expense budget on natural disasters was.

After our office was shaken up by the East Coast Earthquake and pelted with rain by Hurricane Irene, we got to thinking about the freak weather being experienced across the country, and the bigger question of how the damage was being paid for. As it turns out, FEMA is starting to ask itself the same question. We created an infographic that outlines the damage caused in the wake of the natural disasters that have ravaged the country and the amount of money being spent to clean up after them.

They’ve also gone one step farther, and created the SorryMotherNature.com site where anyone can pledge to make a difference.

Please share this post and help spread the word.

Thursday
Jun162011

The Business of Giving


The design of The Business of Giving from SocialCast does a good job of walking the reader through a story about companies donating to charities.  However, they could have done more to visualize the scope of donations instead of just including the dollars values in text.

In the Popular Causes section, I would have built the icons right into the pie chart.  They don’t serve much purpose on their own next to the chart.

I love the puzzle piece images used for Partnerships.

Designed by Column Five Media

Friday
May272011

The Information Blanket

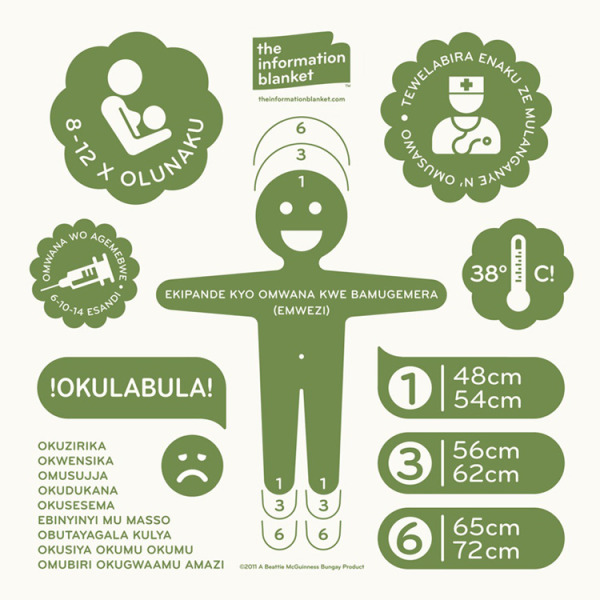
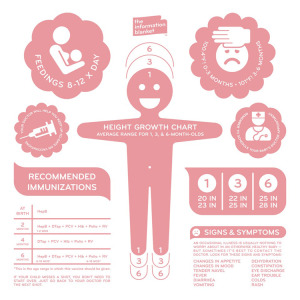
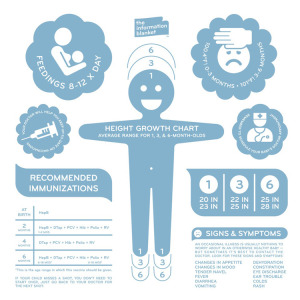
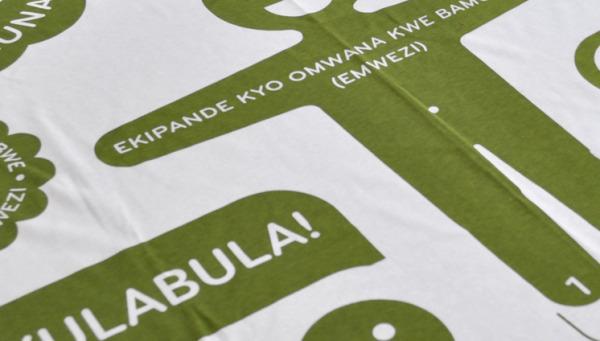
The Information Blanket is a very cool project conceived and produced by Beattie McGuinness Bungay New York.  Intended as a charity blanket to be donated to kids in under-developed countries, the blanket is printed with information to help the mothers learn about their baby’s health.  The blankets include information about breastfeeding, immunization vaccinations, body temperature and warning signs of illness, all printed in the local language.

There are two ways to participate.  You can buy one for yourself, and one will be donated automatically ($60) or you can just donate one to a child Uganda ($25).  The ones you buy for your self are in English (pink or blue), and the ones that will be distributed in Uganda are in Lugandan (green).


the story of our blanket is one of care and responsible craftsmanship. it begins with green-sensitive 100% double knit north carolina cotton. soft and durable, it meets the strictest u.s. environmental standards on dyes and finishing. when it’s ready, the fabric is pre-shrunk and shipped to new york city where local craftsmen cut it to swaddling size and double lock stitch the edges. the informational graphics are then screen-printed using non-toxic water based inks. the result is a blanket of the highest individual quality.

Our design includes a growth chart with average ranges for one, three and six months, breastfeeding and vaccination frequency, high temperature alert, doctors appointment reminder and a list of illness warning signs.


Found on Twitter via @katerryna and Creativity-Online.com