About
Randy Krum
President of InfoNewt.
Data Visualization and Infographic Design

Infographic Design

Infographics Design | Presentations
Consulting | Data Visualizations

DFW DataViz Meetup

Join the DFW Data Visualization and Infographics Meetup Group if you're in the Dallas/Fort Worth area!

Search the Cool Infographics site

Custom Search

Subscriptions:


Feedburner

The Cool Infographics® Gallery:

How to add the
Cool Infographics button to your:

Cool Infographics iOS icon

- iPhone
- iPad
- iPod Touch


Read on Flipboard for iPad and iPhone

Featured in the Tech & Science category

Flipboard icon

Twitter Feed
From the Bookstore

Caffeine Poster

The Caffeine Poster infographic

« Drunk Driving by the Numbers | Main | Caffè Italiano: 50 Types of Italian Coffee »
Thursday
Jun162011

The Business of Giving


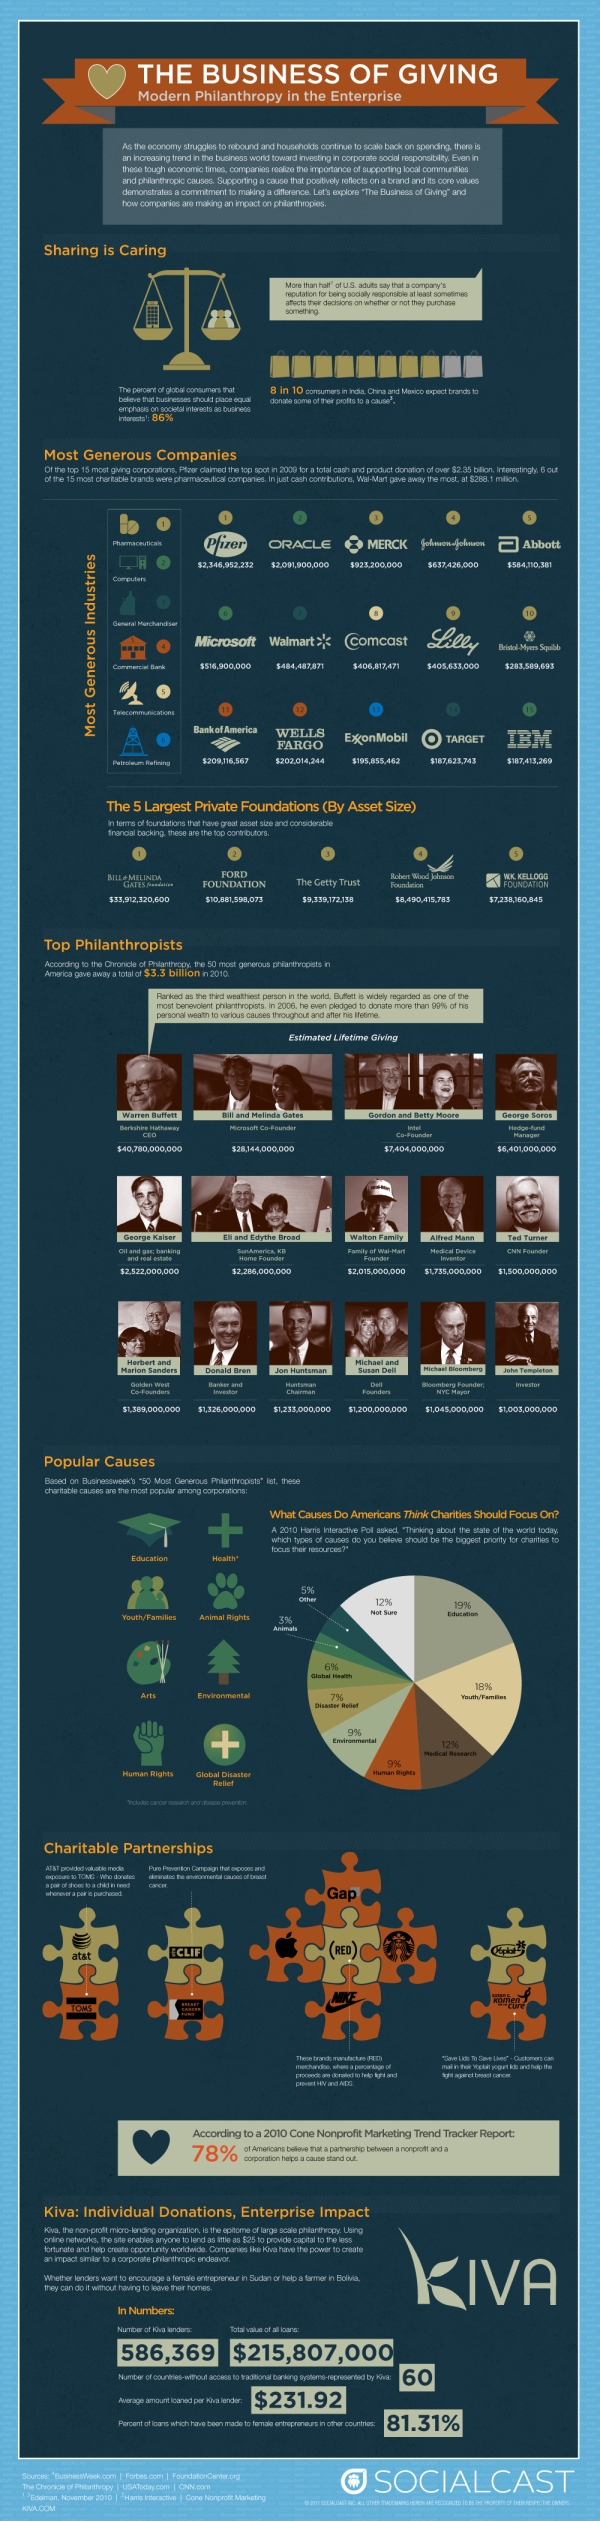
The design of The Business of Giving from SocialCast does a good job of walking the reader through a story about companies donating to charities.  However, they could have done more to visualize the scope of donations instead of just including the dollars values in text.

In the Popular Causes section, I would have built the icons right into the pie chart.  They don’t serve much purpose on their own next to the chart.

I love the puzzle piece images used for Partnerships.

Designed by Column Five Media

PrintView Printer Friendly Version

EmailEmail Article to Friend

Reader Comments (1)

I love this piece! I agree about the popular causes section. The table and chart should have some color association instead, if the table were necessary.

Smooth....
June 22, 2011 | Unregistered CommenterShimon Croxton
Comments for this entry have been disabled. Additional comments may not be added to this entry at this time.