About
Randy Krum
President of InfoNewt.
Data Visualization and Infographic Design

Infographic Design

Infographics Design | Presentations
Consulting | Data Visualizations

DFW DataViz Meetup

Join the DFW Data Visualization and Infographics Meetup Group if you're in the Dallas/Fort Worth area!

Search the Cool Infographics site

Custom Search

Subscriptions:


Feedburner

The Cool Infographics® Gallery:

How to add the
Cool Infographics button to your:

Cool Infographics iOS icon

- iPhone
- iPad
- iPod Touch


Read on Flipboard for iPad and iPhone

Featured in the Tech & Science category

Flipboard icon

Twitter Feed
From the Bookstore

Caffeine Poster

The Caffeine Poster infographic

« Foursquare Reaches 10 Million Users | Main | The Business of Giving »
Monday
Jun202011

Drunk Driving by the Numbers


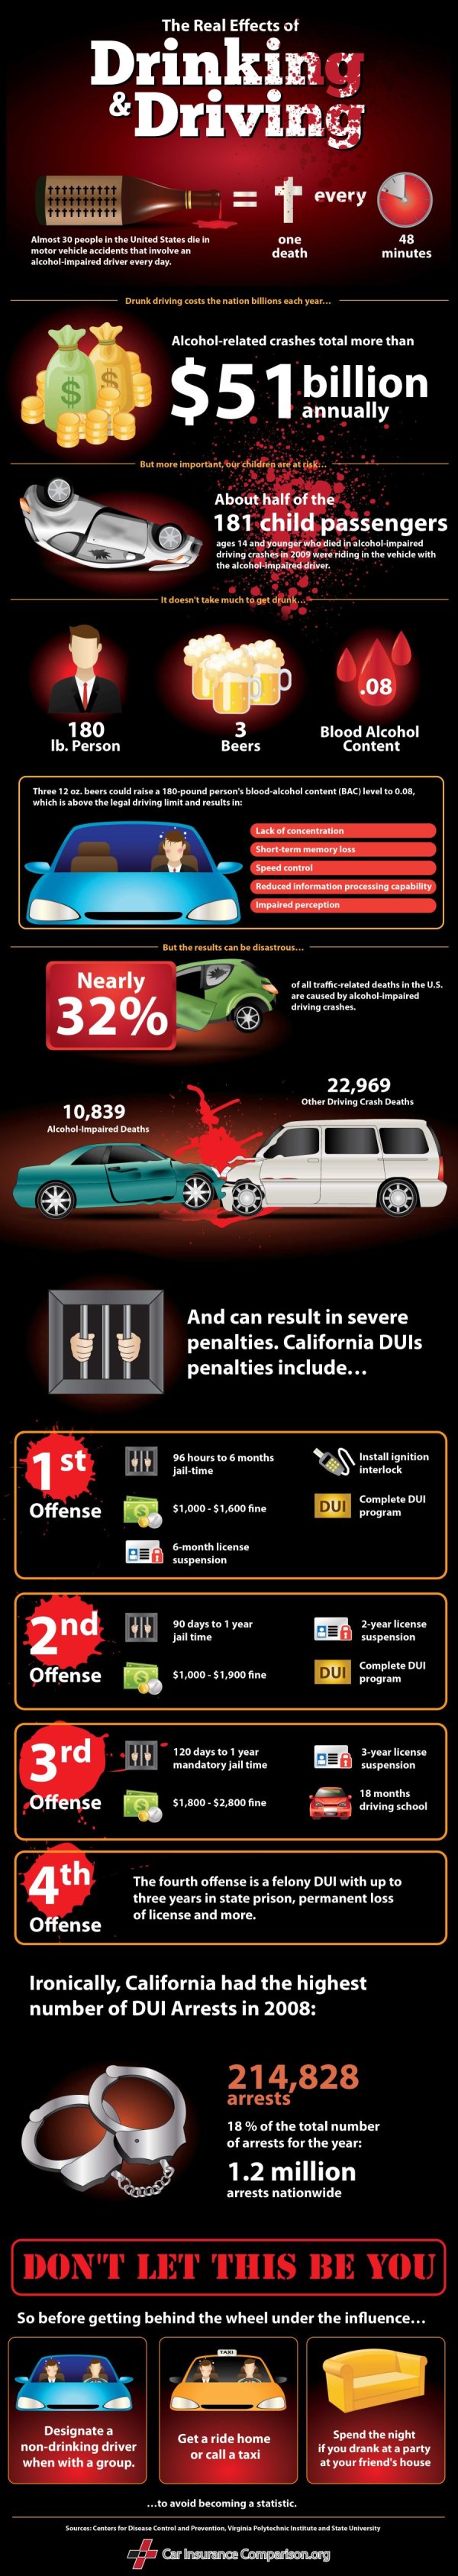
The Real Effects of Drinking and Driving is a good infographic from CarInsuranceComparison.org.  It stays focused and tells one compelling story really well.  Some of the illustrations are just that, illustrations, when they could have visualized the numbers.

Thanks to Clyde for sending in the link!

PrintView Printer Friendly Version

EmailEmail Article to Friend

Reader Comments (3)

This is not an info-graphic, it's illustrated information. What exactly do the illustrations do that the text does not?
June 22, 2011 | Unregistered CommenterTori
What's up with all these superlong scroll-o-graphics?! Who likes it? Who came up with it? Why!? I think it's quite annoying and ugly. Getting your information in an image that FITS your screen is part of your job. If you can't, you should make a poster, not a graphic for web.
June 23, 2011 | Unregistered CommenterBram
This is not an info-graphic, it's illustrated information. What exactly do the illustrations do that the text does not?
August 1, 2011 | Unregistered CommenterHYSEK watches uk sale
Comments for this entry have been disabled. Additional comments may not be added to this entry at this time.