About
Randy Krum
President of InfoNewt.
Data Visualization and Infographic Design

Infographic Design

Infographics Design | Presentations
Consulting | Data Visualizations

DFW DataViz Meetup

Join the DFW Data Visualization and Infographics Meetup Group if you're in the Dallas/Fort Worth area!

Search the Cool Infographics site

Custom Search

Subscriptions:


Feedburner

The Cool Infographics® Gallery:

How to add the
Cool Infographics button to your:

Cool Infographics iOS icon

- iPhone
- iPad
- iPod Touch


Read on Flipboard for iPad and iPhone

Featured in the Tech & Science category

Flipboard icon

Twitter Feed
From the Bookstore

Caffeine Poster

The Caffeine Poster infographic

Entries in electricity (2)

Friday
May052017

Six Maps that Show America’s Infrastructure

Tim Meko, a graphic reported at the Washington Post, designs some fantastic data visualizations. Six Maps that Show the Anatomy of America’s Vast Infrastructure is a great visual exploration of what makes America run. Check out the original article for more explanation of each map and more visual details.

Found on FlowingData

Thursday
Feb112016

Power Hungry: The Rise & Fall of Electricity Consumption

Power Hungry: The Rise & Fall of Electricity Consumption infographic

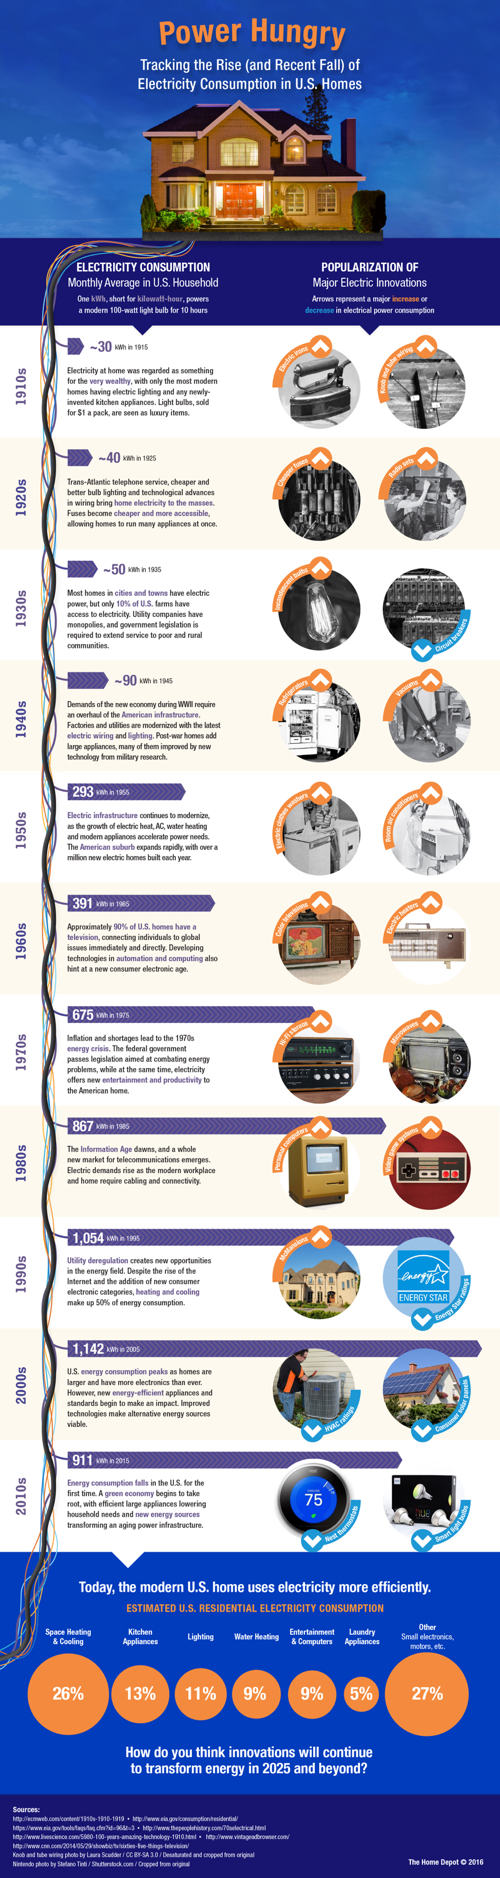
Power Hungry is an infographic timeline showing the dramatic rise in energy consumption for average American homes and the recent change to a decline from energy efficient technologies and home automation. From The Home Depot and published on Inhabitat.

While the U.S. still has a long way to go with alternative energy, a new statistic has given us incredible hope for the future. For the first time in a century, energy consumption in U.S. homes has dropped. Since electricity first entered the home in the 1910’s, residential energy use has been steadily on the rise, but thanks to new developments in alternative technologies, our dependence on electricity is becoming more sustainable than ever before. From small changes, like the rise of circuit breakers and panels, to huge innovations like solar panels and home automation, the road to a cleaner, greener future has been a long — but worthwhile — process. Check out this fascinating infographic below to see how energy consumption has changed over the years.

I love my Nest thermostat and Philips Hue lights!