


Measuring Google AdWords Conversions
 Randy
Randy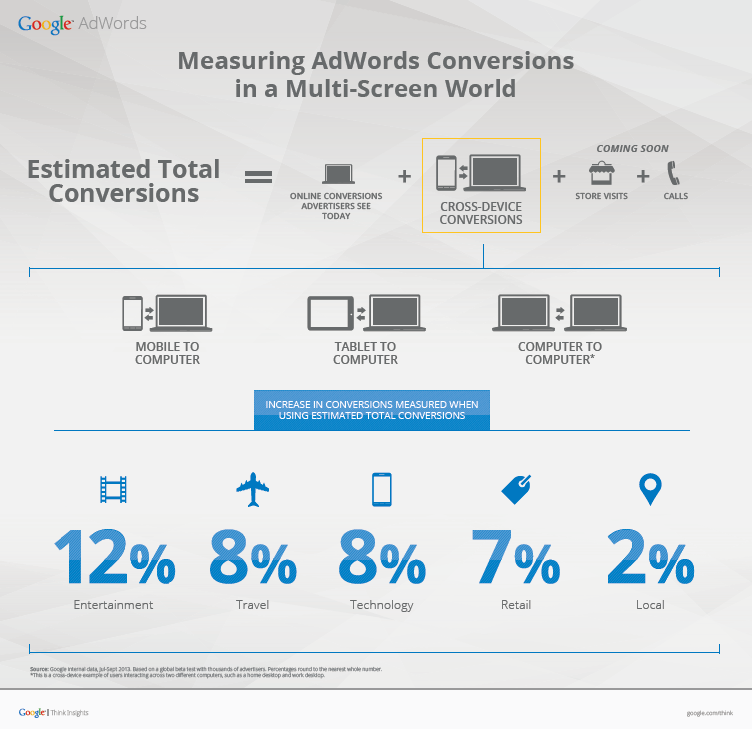
Google AdWords released some fantastic stats about cross-device conversions on their Inside AdWords blog, and included the infographic Measuring AdWords Conversions in a Multi-Screen World to help communicate some of the information.
Estimated cross-device conversions will begin rolling out globally to all AdWords advertisers starting today and continuing over the next few weeks. To see these new statistics, you’ll need AdWords conversion tracking and a sufficient volume of conversions on which to base a reliable estimate.
In the last few months, we’ve analyzed data across thousands of AdWords advertisers to learn more about cross-device conversion patterns.More results from other verticals can be seen below.
The visual diagram helps readers understand the information by narrowing down the scope of the data; clearly identifying it as only a portion of the Estimated Total Conversions. However, they made one of the biggest design mistakes. Big fonts are not data visualizations! Making the percentage numbers big doesn’t put these values into context for the readers and doesn’t make the data any easier to understand.
Found on the D/FW SEM Facebook feed.

Reader Comments (2)
interesting data, although I do not agree with them completely. quality campaign can be achieved 300% better results.