About
Randy Krum
President of InfoNewt.
Data Visualization and Infographic Design

Infographic Design

Infographics Design | Presentations
Consulting | Data Visualizations

DFW DataViz Meetup

Join the DFW Data Visualization and Infographics Meetup Group if you're in the Dallas/Fort Worth area!

Search the Cool Infographics site

Custom Search

Subscriptions:


Feedburner

The Cool Infographics® Gallery:

How to add the
Cool Infographics button to your:

Cool Infographics iOS icon

- iPhone
- iPad
- iPod Touch


Read on Flipboard for iPad and iPhone

Featured in the Tech & Science category

Flipboard icon

Twitter Feed
From the Bookstore

Caffeine Poster

The Caffeine Poster infographic

Entries in Data (85)

Wednesday
Jan232013

LEGO Minifigs

LEGO Minifigs infographic

The LEGO Minifigs infographic is a history of LEGO Minifigs (Mini Figures). The infographic designed by Hot Butter Studio for visual.ly includes the dates when characters were introduced or when a certain feature was added. An added bonus to the infographic is the information about female LEGO minifigs and the FRIENDS line that was designed primarily for girls.

This is a fun infographic with some interesting factoids that will keep readers engaged with the design.  LEGOs are cool right now, so the timing for this design is good.  It’s also a topic that has not been well covered in infographics, so it stands out as unique information.

I wish a few of the data points were visualized like number of minifigs sold each year or space events along an actual timeline visual.

Thanks to Karyn for sending in the link!

Wednesday
Jan092013

Strata Conference CA Feb 26-28 - 20% Discount Code

2013 Strata Conference

If you have any thoughts of attending the 2013 Strata Conference in Santa Clara, CA, the discount code “COOL20” will cut 20% off the registration price for readers of Cool Infographics!  Big data, visualization, privacy, science and business!  What’s not to love?!?

This is an expensive conference, so the 20% discount is a BIG deal; saving hundreds of dollars!  The 2013 conference will run from February 26-28, 2013 in Santa Clara, CA.  If you can register early…

Early REGISTRATION Prices END THURSDAY, January 17TH!

Strata Conference 2013 - Feb 26-28, 2013 in Santa Clara, CA

Join the best minds in data for the latest in the data revolution: trends, tools, new practices, careers, and culture. Bringing together decision-makers, practitioners, and leading vendors from enterprise and the web, Strata provides three days of training, breakout sessions, and plenary discussions, along with an expo hall showcasing the new data ecosystem.

 Check out the video including clips from some of the prior presentations!


Wednesday
Dec262012

Top 20 Field Service Management Software Solutions

Top 20 Field Service Management Software infographic

The new Top 20 Field Service Management Software infographic from Capterra continues their series of “Top 20 Most Popular” infographics for different software categories.  I’ve previously posted about the Top 20 Marketing Automation Software Solutions and the Top 20 Medical Records Software Solutions.

This design shows a little more detail behind how they score and rank the different software options.

Field Service Management software serves companies that send technicians or other employees into the field by helping them automate scheduling and dispatching. Below is a look at the most popular options as measured by a combination of their total number of clients, active users and online presence. In order to see a comprehensive list, please visit our Field Service Management Software Directory.

Capterra developed a popularity index consisting of three components to rank the field service management providers: number of customers (40%), number of end users (40%), and online presence (20%). The online presence metrics included traffic estimates from Compete.com, as well as the company’s number of LinkedIn followers, Facebook page likes, Twitter followers, and Klout scores – each weighted equally to comprise 20% of the vendor’s overall score.

The stacked bars to showing the three separate score metrics works nicely, and is a clear visual of the descending total scores.  The Rank numbers are in colored boxes that match the primary brand colors of each software company, but the readers don’t know that.  Without seeing the actual company logos, the colors just look random and create some unnecessary visual noise.

By not showing the company logos throughout the design, it’s harder for the reader to see where a particular company appears in the different sections.  A visual logo would be easy to recognize at a glance, but in just text, the reader has to read every entry to try to find a match.

Nice, clear Call-To-Action at the end of the design, so the target audience readers know what they should with this information.  The footer should also include a copyright statement and the URL link to the infographic landing page on Capterra’s site so readers can find the original, full-size version.


Monday
Dec242012

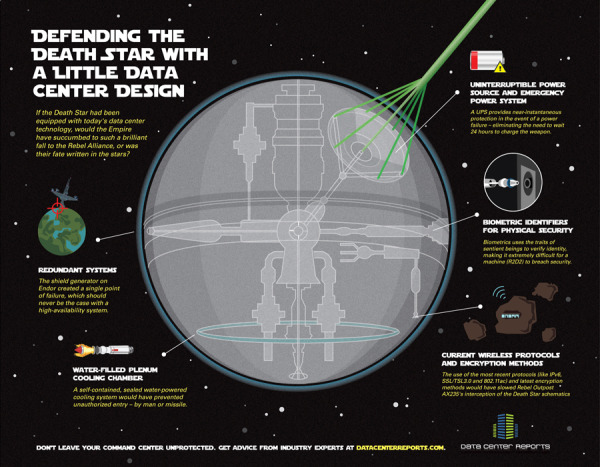
Defending the Death Star

Defending the Death Star with A little Data Center Design infographic

Old age meets new age. Defending the Death Star with A little Data Center Design takes a concept that people can relate to (Star Wars) and applies modern day data center technologies. Brought to you by Data Center Reports.

When Aristotle first explained the concept of “hamartia” in Poetics, he probably didn’t know just how many hero and villain stories would be driven forward by fatal flaws in character, judgment or planning. The Star Wars saga is an epic tale that is powered by fatal flaws – yet we couldn’t help but wonder how things might have turned out had the Empire used a little of today’s security insights to better protect the superweapon better known as the Death Star.

This infographic design tells a good story with illustrations.  No big data sets to visualize, but a simple story that’s incredibly easy for the reader to understand.  The Star Wars comparison puts the different technologies into context for the reader.

The footer should include a copyright and the URL link to the original infographic so readers can easily find the original high-resolution version.

Found on Data Center Reports

Thursday
Dec062012

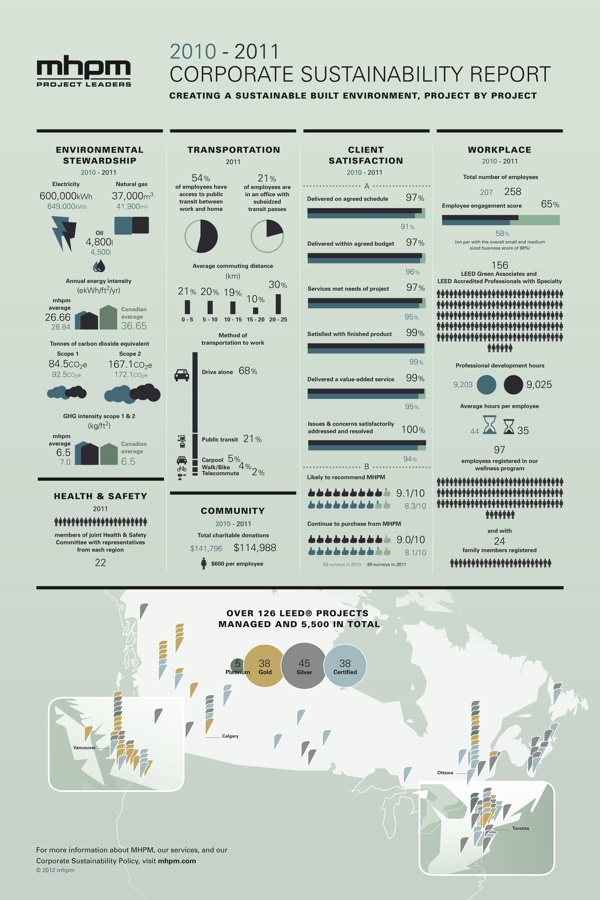
MHPM's Infographic CSR (Corporate Sustainability Report)

MHPM's Infographic CSR (Corporate Sustainability Report)

MHPM Project Managers has taken a different approach with the release their first CSR (Corporate Sustainability Report).  Instead of the normal text report that other companies release, MHPM created an infographic poster with all of their sustainability information.  It serves as a great example to their clients of how even CSR data can be designed in an engaging way.

MHPM Project Leaders passed a milestone towards integrating sustainable practices into its business operations today, with the release of its first annual corporate sustainability report.

MHPM’s corporate sustainability report evaluates MHPM’s impact on the environment and the community, its transportation practices and workplace policies. The findings reveal areas for improvement and provide a benchmark against which to measure future performance.

Designed by InfoNewt, this poster was printed at 24” x 36” by MHPM and is also available online on the Corporate Sustainability Report section of their website.  The front side of the post visualizes all of the data, and puts most of it into context by comparing to prior year results.  The back side of the design includes all of the required text, which keeps the front side less cluttered and easy to read.  The entire design is inspired by the Global Reporting Initiative’s guidelines.

This is a fantastic use of infographic design principles!  The full size, high-resolution poster is available as a PDF download from the CSR page.

Thursday
Nov292012

40 Must-See Modern Marketing Charts

40 Must-See Modern Marketing Charts

Eloqua has teamed up with infographic design firm JESS3 again to create Modern Marketing Insights, a series of 40 infographics using big data analysis that can help marketers anywhere.

Did you know that dynamic content can improve conversions by 50%? Or that emails sent on a Saturday get the highest number of click-throughs? Were you aware that when influencers share your content on social it can result in a dramatic increase in traffic and conversions?

That’s why we produce a chart every week that modern marketers can easily learn from and use. And it’s why we’ve gone back with our friends at JESS3 to reproduce the most indispensable data points, coming up with 40 understandable, actionable charts. Wide-ranging in scope, the charts hit the most important topics hitting marketers today – from social media to email.

With that in mind, we offer the charts in two forms. You can head over to the custom-made website and explore the charts by topic, getting to the data that matters most to you. Or you can download all 40 charts in a free eBook. It’s well worth keeping near your desk.


40 Must-See Modern Marketing Charts

Even those each of these is only exploring one data set, these are actually good infographic designs that follow some important design rules.

First, each one tells one story really well, and the Key Message is easy to understand.  Most readers of infographics are only looking at a design for less than 5 seconds, and a good infographic design will successfully communicate their primary message in that short time.

Second, each design is easy to share.  Each of the 40 designs has it’s own landing page on Eloqua’s site, and their own dedicated social media sharing buttons.  This is fantastic for SEO, and much easier to utilize the information for users.  So, if you’re interested in a data set about email to customers, you can share that information with colleagues without also sharing a data set about Pinterest.

You can read more about the series on the Eloqua blog.


40 Must-See Modern Marketing Charts

A couple things I do think are missing from each design that would help Eloqua in the future.

  • Since these are being shared individually, the URL back to the original on Eloqua site should be included in the image.
  • A copyright statement to clarify usage rights.  Does everyone have permission from Eloqua to include these charts and data in their own presentations?
  • Much of the data is proprietary to Eloqua, so the raw data behind the designs isn’t available to the public.  It would be great for Eloqua to make the data behind each chart available publicly (like in a Google Docs spreadsheet) since they are making the data public in the charts.
  • A conclusion.  I think the subtle implication is that companies should call Eloqua for help using this information, but a short statement suggesting what action companies should take based on each data set would close each design nicely.

Thanks to Jarred for sending in the link!

Tuesday
Nov272012

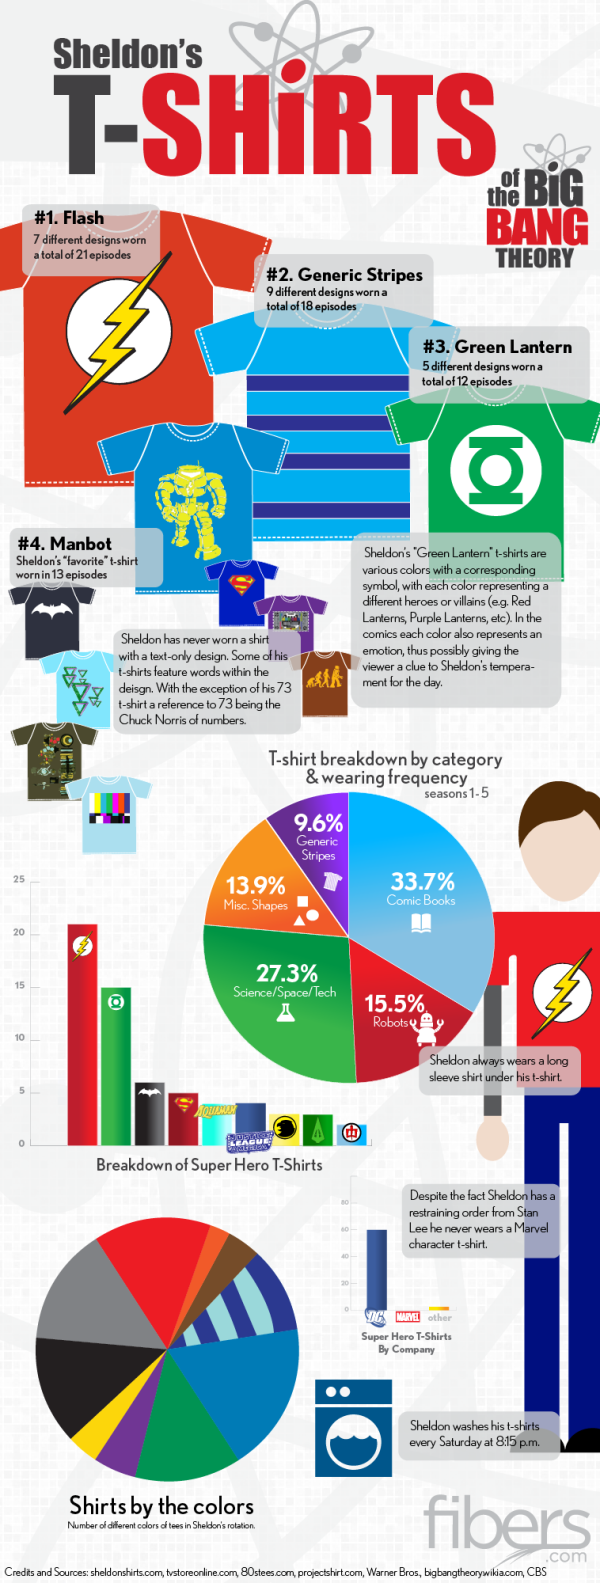
Sheldon's T-Shirts of The Big Bang Theory

Sheldon's T-Shirts of The Big Bang Theory infographic

If you have seen the comedy show The Big Bang Theory, then you know Sheldon…. If you haven’t seen it, go watch it and get back to us.  Have you ever noticed his wardrobe?  The Sheldon’s T-Shirts infographic from fibers.com tells you his favorite shirts, how often he wears his shirts, and even what colors he wears the most! 

Graphs, Charts and illustrated T-Shirts with correlating sizes to wearing frequency - would there be any other way to visualize Sheldon Cooper’s t-shirt collection from The Big Bang Theory? We think not.

Big thanks to Sheldon’s Shirts where we got most of the data for this graphic. You can find a lot of Sheldon’s Shirts for purchase on the following websites:

This is just a fun infographic that uses some data visualization to appeal to fans of the show.  Good design using publicly available data that has been complied in an engaging way.

The charts actually very well done.  Charts are color-coded to match the data.  Icons are included on the bars or in the pie slices, so no chart legends are needed.  This makes the data faster and easier to understand.

Found on Fibers.com

Tuesday
Oct232012

Tracking American Poverty - interactive infographic

Tracking American Poverty - interactive infographic

Tracking American Poverty & Policy is an interactive infographic visualization site that breaks down the data about…you guessed it…poverty in America.

The site provides a sequence of interactive pages that start with the overall poverty numbers, and then break them down in more detail by race, gender, education, age and family type.  In addition to the initial pie charts for the official poverty rate, the visualizations change to show details for Near Poverty, In Poverty and Deep Poverty numbers when you hover your pointer over each chart.


Tracking American Poverty - interactive infographic

You also have the option on each page to change the year to see how the number have changed from 1967 - 2010.

Good visualization design by Two-N 

Wednesday
Sep262012

How Much Does SEO Cost?

How Much Does SEO Cost? infographic

How Much Does SEO Cost? is generally a mystery in the online marketing world.  The range is certainly big, from under $50/month up to the unbelievable price of over $250,000/month!  This informative infographic shares the results of custom research from SEOmoz, and was designed by AYTM.

How much does SEO cost? How much time do you have to discuss the various models and prices out there! However, a new survey sheds some light on the subject.

Over 500 people and companies who offer search engine optimization services were asked about how their models. Turns out, it’s most common to charge $100 to $150 per hour, in the US. But by-the-hour consulting is only one of four nearly co-equal ways of charging.

Also popular is project-based pricing, where the average price is between $2,500 to $5,000, in the US. That’s also the same average price for those who buy on a monthly retainer basis. Fixed prices on a contract basis is also a popular way that SEO is sold, but no averages were provided.

The survey was conducted by SEOmoz and compiled into the infographic below by AYTM:

From a design standpoint, there are a lot of things I like about this infographic.  

The consistent columns for regions of the world make the layout very easy to follow.  The data is also organized nicely by starting with basic demographic data to provide a foundation to the reader before getting into “The Main Event” - the main research results.

The data visualizations are fairly simple, and very easy for the reader to understand.  I also like the variety of data visualization methods; no one wants to see all bar charts.  The color scheme is also simple, which visually implies a certain level of authority.  By taking complex data and designing simple visualizations, the design shows the readers that SEOmoz has a clear understanding of the content.

The actual values are not included in the design, which is disappointing.  Since this was custom primary research, I have no way to validate the data visualizations without seeing the data, and that reduces the credibility of the entire design.  From a sharing perspective, it’s hard to quote interesting statistics in a text Tweet or Facebook post without having the numbers to work with.

Legends are Evil!  My biggest complaint is their use of legends in a few sections.  In those charts, the colors are visually hard to differentiate, and the reader has to work very hard to understand which pie slice or bar goes with each color.  This is only a problem in the Agency Type and Common Client Types sections.  The rest do a good job of connecting the data labels directly to the visualization.

The footer should include some type of copyright statement, and the URL for readers to find the original infographic landing page.

Found on Visual Loop

Tuesday
Sep042012

2011 Wisconsin Crash Calendar & Interview

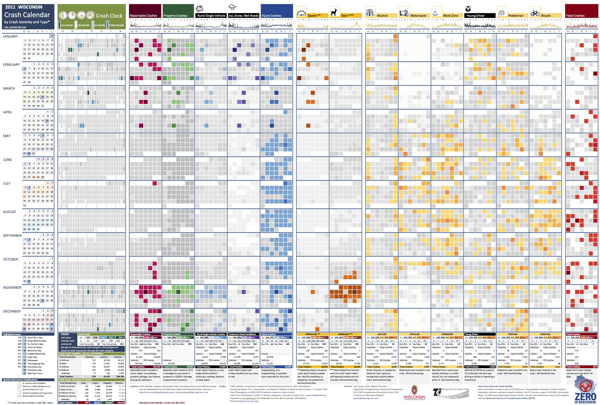
2011 Wisconsin Crash Calendar infographic

I love this infographic design!  Designed by Joni Graves, a Program Director at the University of Wisconsin-Madison Department of Engineering Professional Development (that’s a mouthful!).  I highly recommend downloading the PDF version and taking a closer look on your own.

The original version and a few variations are available on a couple different official sites:

The Wisconsin Bureau of Transportation Safety (BOTS) uses printed copies of the infographic calendar at meetings around the state with various groups to generate discussions about what causes crashes and how to interpret what the data shows.

This design is a great example of how visualizing the data allows the readers to see patterns in the data and much more easily understand the stories behind the data.  The color coding makes it easy to compare the data subsets, and the consistent layout to match a traditional paper calendar is very easy to follow.

There are so many findings you can quickly see in the big dataset.  Some are obvious, but many are surprising.  For example, you can clearly see…

  • Alcohol-related crashes happen primarily on weekends, and fairly consistently throughout the year.
  • Deer Season is clearly identified in Oct-Nov.
  • There was something special about July 1st…
  • Motorcycle, Work Zone and Bicycle crashes occur during the Summer months.
  • Ice, Snow, Wet Road crashes are highest in Jan-Feb, but what happened on April19th?  Late Winter storm?
  • Speed related crashes are primarily reported in the Winter months.
  • Fatal crashes are evenly spread throughout the year

Joni was also willing to answer some interview questions about this project and her design process:

Cool Infographics: What software applications did you use to create the Crash Calendar?

Joni Graves: EXCEL 2010 using Pivot Tables. Presentation advancements incorporate Microsoft’s PowerPivot using SharePoint.

Cool Infographics: Was the design created in cooperation with the Wisconsin Transportation Information Center, or was it an independent project? 

Joni Graves: I’m a Program Director at the UW-Madison Department of Engineering Professional Development and part of the WI LTAP (FHWA’s Local Transportation Assistance Program) / Wisconsin Transportation Information Center (TIC).

Cool Infographics: How long did the design take you to create?

Joni Graves: It’s a longer story, if you’re interested, but the skinny is that I started working on the Crash Calendar format in mid-April and previewed it at a meeting the end of the month. I had a learning curve with some of the intricacies, and spent about 200 hours on it during that two weeks! Since then it’s taken on a life of its own — and I am delighted by that!

Cool Infographics: Would you describe your design process?

Joni Graves: I would be happy to elaborate on this but, as an inveterate designer / tinkerer, I’ll confess that I’m always discovering some new way of formatting / displaying the data, and disappointed that there’s never enough time to do the new ideas justice …

Cool Infographics: What’s the most interesting thing you learned from the data?

Joni Graves: I’ve certainly enjoyed the design process! More importantly, it’s been incredibly satisfying to see people engage w/ the data using this intuitive representation, or to read their comments, because it’s apparent that it helps make the data far more accessible! And I have loved the comments / responses.

Cool Infographics: What was the hardest part behind designing the Crash Calendar?

Joni Graves: As I noted, there’s been a fascinating learning curve. But the hardest part has been stopping! As noted above, I’m always trying to “improve” it — and always running out of time.

Cool Infographics: What should we expect from future versions of the design?

Joni Graves: We currently have a multi-year version, a web-demo site, and a working 2012 version. I’m very excited about incorporating choropleth maps. Although it’s a very interesting “historic” document, the real goal is to provide a resource that is far more timely and potentially predictive for local users. 

I’m really excited about our plans to webize it, because the real idea is to expand it as a national project — using multi-year FARS data, WI data, and data from other interested states — and we really want to “unleash” it for others to actively use. 

Cool Infographics: Challenges?

Joni Graves: There’s been a wonderful response — and we are trying to figure out how to actually fund an expanded project w/ enhancements!

One additional thing to note was that Joni was inspired to create the whole design project by Nathan Yau’s post on Vehicles involved in fatal crashes in 2010 (which I posted about here earlier this year), and I think she has done a great job building Nathan’s initial visualization into some something much more powerful and effective.

Thanks to Joni for sharing!