About
Randy Krum
President of InfoNewt.
Data Visualization and Infographic Design

Infographic Design

Infographics Design | Presentations
Consulting | Data Visualizations

DFW DataViz Meetup

Join the DFW Data Visualization and Infographics Meetup Group if you're in the Dallas/Fort Worth area!

Search the Cool Infographics site

Custom Search

Subscriptions:


Feedburner

The Cool Infographics® Gallery:

How to add the
Cool Infographics button to your:

Cool Infographics iOS icon

- iPhone
- iPad
- iPod Touch


Read on Flipboard for iPad and iPhone

Featured in the Tech & Science category

Flipboard icon

Twitter Feed
From the Bookstore

Caffeine Poster

The Caffeine Poster infographic

Entries in Data (85)

Monday
Apr022012

Jer Thorp: Make data more human

Jer Thorp works in the New York Times labs to design big data visualizations, and his great presentation from TEDxVancouver was just posted.

Jer Thorp creates beautiful data visualizations to put abstract data into a human context. At TEDxVancouver, he shares his moving projects, from graphing an entire year’s news cycle, to mapping the way people share articles across the internet.

Jer Thorp’s work focuses on adding meaning and narrative to huge amounts of data as a way to help people take control of the information that surrounds them.

He’s been involved in some great big data projects that I have posted about here on the blog previously, like OpenPaths.

Friday
Feb102012

What's In Your Trash?

The What’s In Your Trash infographic explores what constitutes trash in America.  From Bolt Insurance, this design breaks down all of the stuff we throw away.

The cleaning services industry brings in more than $50 billion a year, from janitorial services to residential cleaning agencies, and the industry is projected to continue growing. Americans generated more than 250 tons of garbage in 2010. In BOLT’s What’s In Your Trash infographic, find out what is really in your trash and how important cleaning services and janitorial services are. Through recycling and waste incineration, as much as 90% of waste can bypass the landfill! Presented as an infographic (created for BOLT by Infographic World) to help you more easily visualize and retain this important information.

Although there is a lot of text here that could have been visualized (big fonts aren’t a data visualization), I really like the doughnut segments split apart to show different components of the trash.  It helps tell the story and lead the reader through the information top-to-bottom of the design.

Thanks to Jane for sending in the link!

Wednesday
Feb082012

Client Infographic: Hotels.com Romance Survey


Hotels.com has released two Romance Survey infographics that share their own research behind romance and Valentine’s Day.  Designed by InfoNewt with designer Jeremy Yingling, the two versions cover research data both the U.S. and Canada.

Pack your bags, Sweetie Pie, we’re going on a romantic getaway!  We surveyed guys and gals of different ages who shared their secret dreams about the perfect romantic weekend.  Here’s how our lovebirds responded.

It’s fun, timely information that has a long Online Lifespan (won’t change over time), so the infographics will be relevant for years.  There was a lot of survey data, and I really like how the final result mixes up different ways to look at the aggregate data by also using the available demographics to show findings by age and gender.

I was impressed with the chivalry shown by 58% of men (both in the U.S. and Canada) that feel they need to plan and pay for a romantic Valentine’s date.


Thanks to the Hotels.com team for being great to work with!

Monday
Feb062012

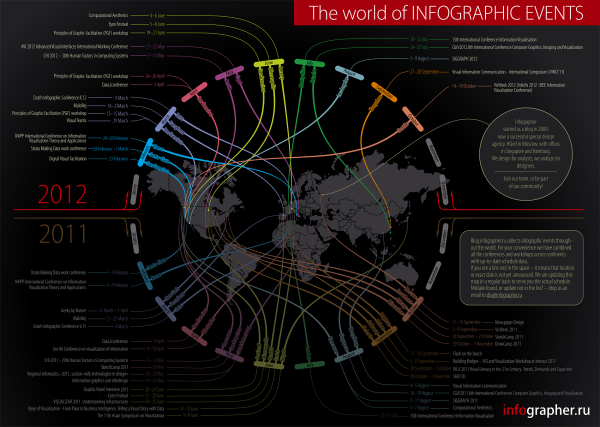
Infographic Events Calendar 2011-2012

Outstanding calendar-map infographic from Infographer.ru, a Russian infographics site and design agency in Moscow (view in English).  The Infographic Events Calendar 2011-2012 shows many (but not all) visualization, data and infographic conferences and events around the globe.

For everyone who is interested in information design we prepared the events calendar. We found over 44 conferences and workshops, dedicated to infographics and visualization topic all over the world.

The idea to make this kind of ‘map-calendar’ of events appeared in our mind a long time ago, we started to collect data in 2011 and suddenly 2012 started. So we decided to combine both years and show the history for 2011 and actual events for 2012, which you can use for your personal planning.

They collected over 40 conferences and workshops dedicated to information visualization for last year and the upcoming schedule for 2012.  The calendar-map color codes the events by month and obviously connects them to the correct location on the world map.

If you know any corrections or additions to the event included, please post them in the comments!  I know they will be reading them, and would welcome all feedback.  Here are a few events I think they should add to their list:

  • South by Southwest Interactive, Austin, TX, March 9-13, 2012
  • TDWI World Conference (Tableau), Las Vegas, NV, February 13-15, 2012
  • Big Data 2012, Paris, France,  March 20-21, 2012

I like the text of the city name included in the connecting lines, and the months with no events are gray so they don’t add to the visual noise of the bright colors.  Somewhere on the design they should have included the URL for people to find their original posting.  When this get shared online, readers will have a hard time finding the original site.

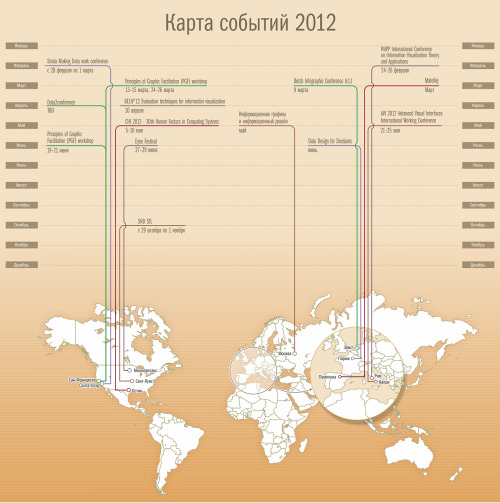
Infographer also posted some behind-the-scenes information about the development of the design.  Check out their early drafts in the complete blog post.

Thanks to Irina for sending in the link and posting the English translation of the development process!

Monday
Jan302012

Client Infographic: Top 20 Medical Records Software Solutions

A new infographic design from InfoNewt for CapterraTop 20 Most Popular EMR (Electronic Medical Records) Software Solutions shows the results of comparing Capterra’s Popularity calculations in the EMR software category.

As the deadline for implementation in the U.S. draws near, talk of electronic medical records (EMR) and electronic health records (EHR) software is a hot topic at the doctor’s office lately. These systems assist medical practitioners in the creation, storage, and organization of electronic medical records, including patient charts, electronic prescriptions, lab orders, and evaluations (just to name a few common features). While the terms “EMR” and “EHR” are often used interchangeably, EMR solutions allow for patient information to be shared within one health care organization, whereas EHR solutions allow for health-related records to be shared across multiple organizations. Below is a look at some of the most popular options in both categories, but to see a comprehensive list, visit our EMR Software Directory. You can also click on any of the company logos in the graphic to go directly to their websites.

Capterra’s listing current shows 324 EMR software solutions, and for their target audience this is a very hot topic with an upcoming Federal requirement in the U.S. to make all medical records electronic by 2014.  This is a HUGE issue to convert millions of patient records over the next few years, and practitioners obviously only want to do this once, so picking the right platform up front is critical!

Similar to the Top 20 Marketing Automation Software design, this design features a large pie chart as the primary visualization, and then provides additional information.  The main data is Capterra’s Popularity calculations which combine total users, customers, revenue, social media followers and website rankings.  Again, the specific percantage values weren’t as important as the ranking and visually showing how the packages compare.

This software category has the added complication that the different software packages are written for different sizes of medical organizations.  Single medical practitioners don’t need the same software (or have the same budgets) as hospitals.  We also added the element of showing which hardware platforms each package is design to use.  Microsoft Windows hardware is clearly dominant, but Apple hardware and Cloud-based solutions made up 30% of searches in this category.

Capterra is the authority when it comes to finding software solutions for businesses, and they’ve done some great work gathering data and measuring the relative popularity of different software categories.  Although popularity doesn’t necessarily mean the software is right for your business, it is a really good indicator that the solution is working successfully for many businesses and may be worth a closer look.  A better indicator than just total revenue or trying to rate “the best.”  You can read their comprehensive blog post about the data behind the infographic.

Thanks to the team at Capterra for being great to work with!

Thursday
Jan122012

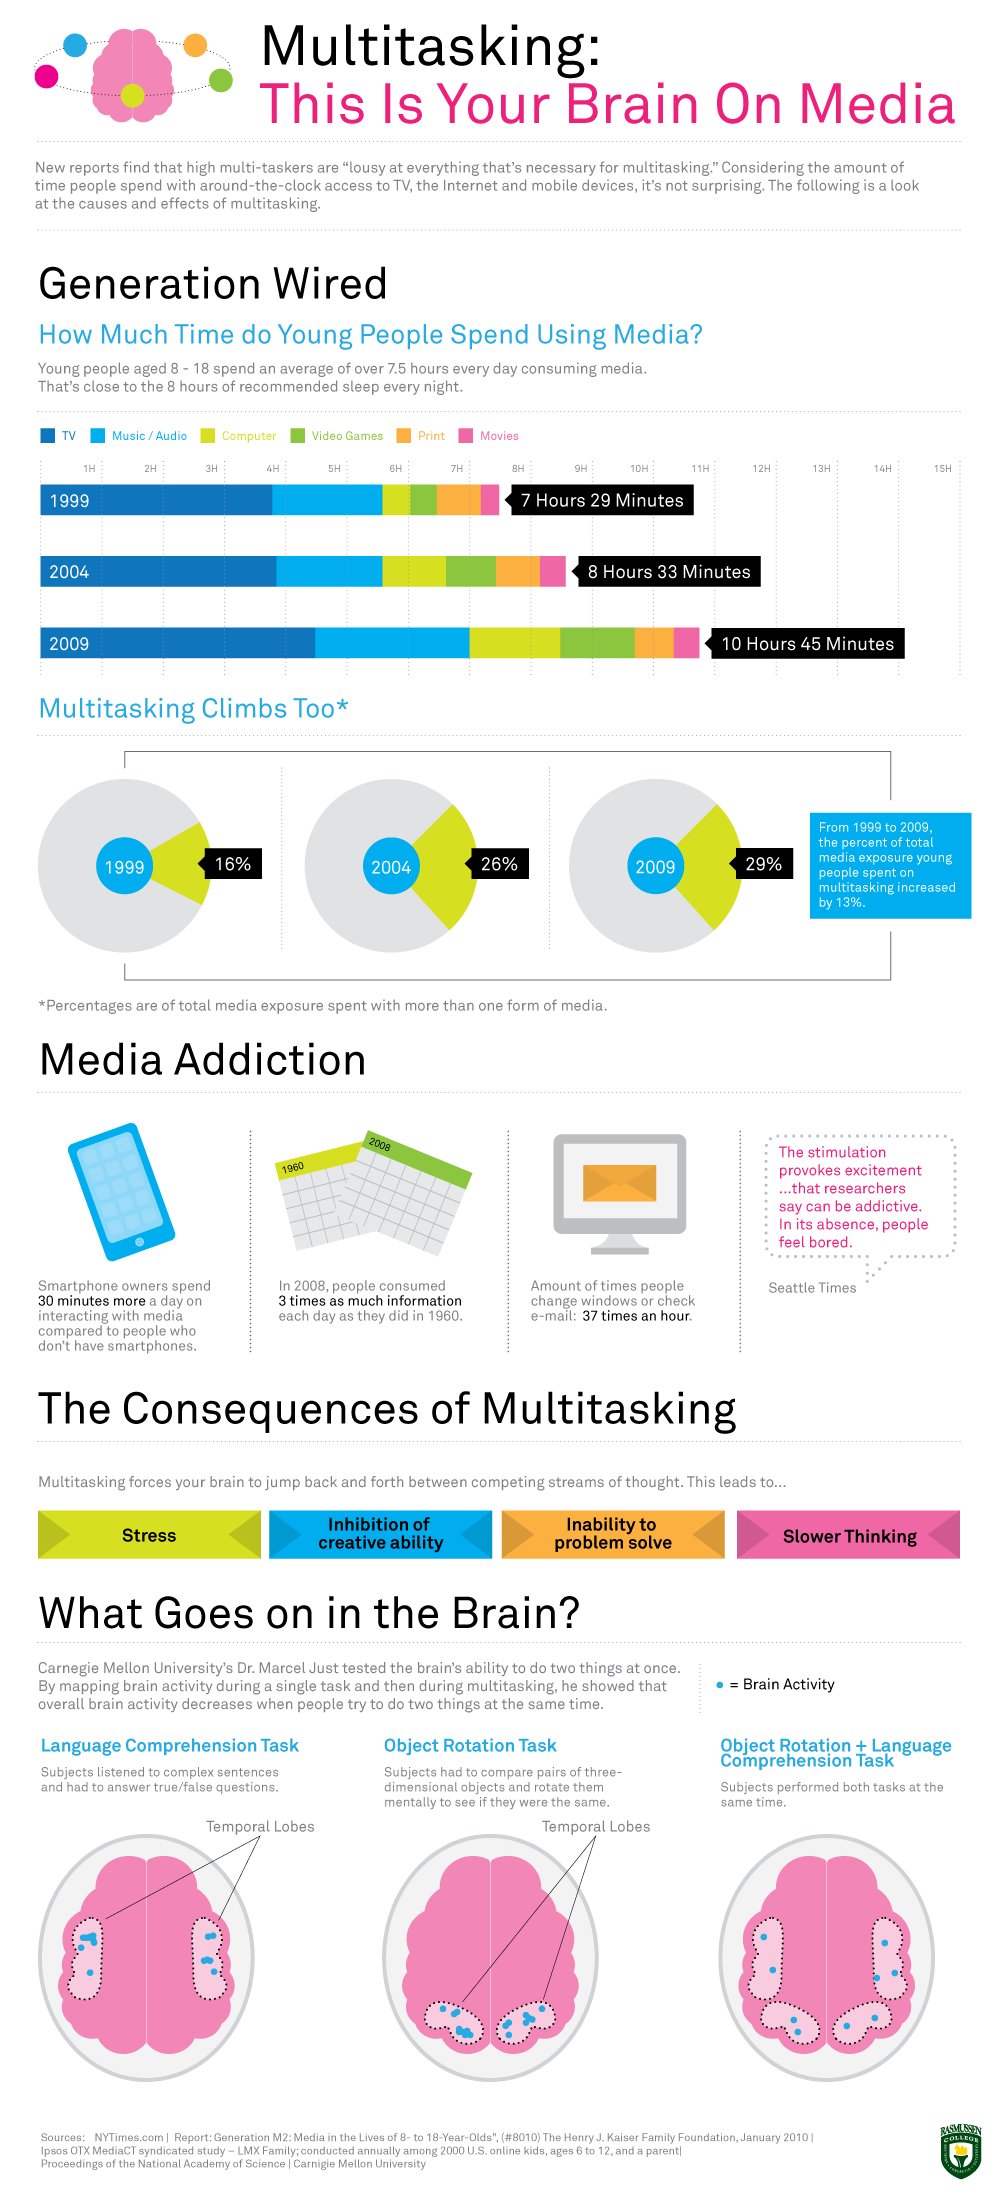
Multitasking: This Is Your Brain On Media

From Rasmussen College, Multitasking: This Is Your Brain On Media is a cool infographic design that looks at some of the research behind multitasking.

New reports find that multi-taskers are “lousy at everything that’s necessary for multi-tasking.” Considering the amount of time people spend with around-the-clock access to TV, the Internet and mobile devices, it’s not surprising.This infographic looks at the causes and effects of multi-tasking.

From a design perspective, I like the clean look with a simple color palate that is easy on the eyes.  The statistics in the Media Addiction section could have been visualized to make them easier to comprehend.  Without visualizations, this section feel less important compared to the rest of the data.

I love the brain diagrams.  I’m sure there are hundreds of pages of reports from this research, but this simple visual tells the story quickly to the reader.  The design is missing the URL to the original landing page, a copyright (or Creative Commons) statement and listing the designer.

Found on Infographics Journal

Wednesday
Jan112012

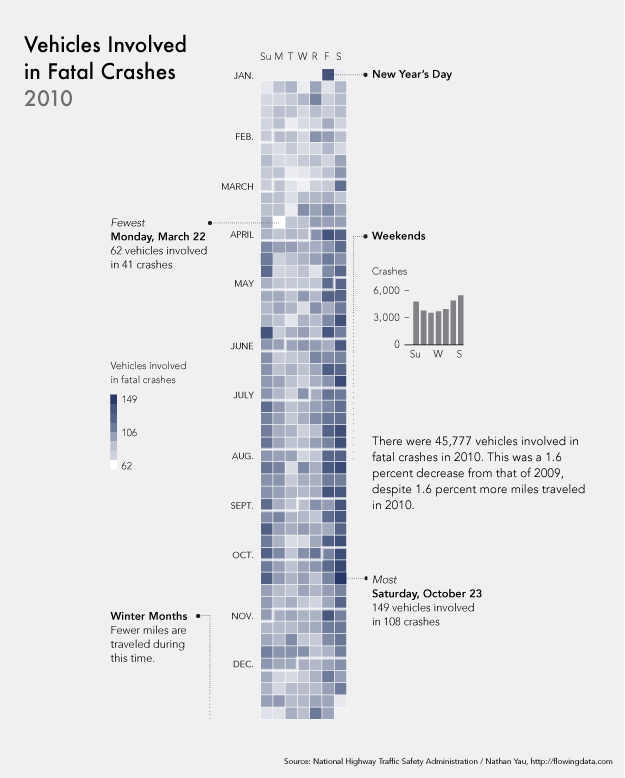
Calendar Visualization of Fatal Car Crashes

I really like this data visualization from Nathan Yau at FlowingData.comVehicles Involved in Fatal Crashes 2010 takes a new look at the statistics released by the U.S. National Highway Traffic Safety Administration.  Instead of plotting them on a traditional map, Nathan looked at the time data.

After seeing this map on The Guardian, I was curious about what other data was available from the National Highway Traffic Safety Association. It turns out there’s a lot and it’s relatively easy to access via FTP. What’s most surprising is that it’s detailed and fairly complete, with columns for weather, number of people involved, date and time of accidents, and a lot more.

The above shows vehicles involved in fatal crashes in 2010 (which is different from number of crashes or number of fatalities). This data was just released last month, at the end of 2011 oddly enough. It’s a calendar view with months stacked on top of one another and darker days indicate more vehicles involved.

- Nathan Yau

As was suggested by others in the comments on FlowingData, I agree that since the weekends have the higher incidence rate, starting the week with Monday and moving Sunday to the last column may show that a little bit clearer.

Nathan has made all of the data avaialble for anyone that would like to try a visualization themselves.  Student project?

Thursday
Dec152011

Strata Conference - 20% Discount Code

If you have any thoughts of attending the 2012 Strata Conference, the discount code “COOL20” will cut 20% off the registration price for readers of Cool Infographics!  Big data, visualization, privacy, science and business!  What’s not to love?!?

This is an expensive conference, so the 20% discount is a big deal!  The 2012 conference will run from February 28 - March 1 in Santa Clara, California.

Strata Conference is the leading event for the people and technology driving the data revolution. The home of data science, Strata brings together practitioners, researchers, IT leaders and entrepreneurs to discuss big data, Hadoop, analytics, visualization and data markets.

Check out some of the videos on the Strata site to see the presentations from 2011!

Tuesday
Dec132011

Social Media Stats of the Day


This is a LONG one, but a good one based on statistics recently published in AdAge.  Social Media Stats of the Day from Dream Systems Media visualizes some fo the recent stats about Favebook Twitter and general Social Media usage.

Saw an article on Social Media stats the other day on AdAge by Sarah Evans (awesome list of stats she compiled) and of course, me being who I am, I wanted to visualize the data. So enjoy! I used several of these statistics in my recent SMX Social Media Scottsdale presentation on SoLoMo – Checking into the real world.

- Mat Siltala

I really like the coloring in this design that visually ties the data to the Facebook and Twitter brands instantly for the readers.  Although, big fonts don’t make a data visualization, and a number of percentages included could easily have been visualized as simple pie charts or stacked bar charts.  I do think there is too much text in the design, but I can appreciate how specific you have to be when describing the research data and where it came from.

Nice job Mat!

Wednesday
Nov022011

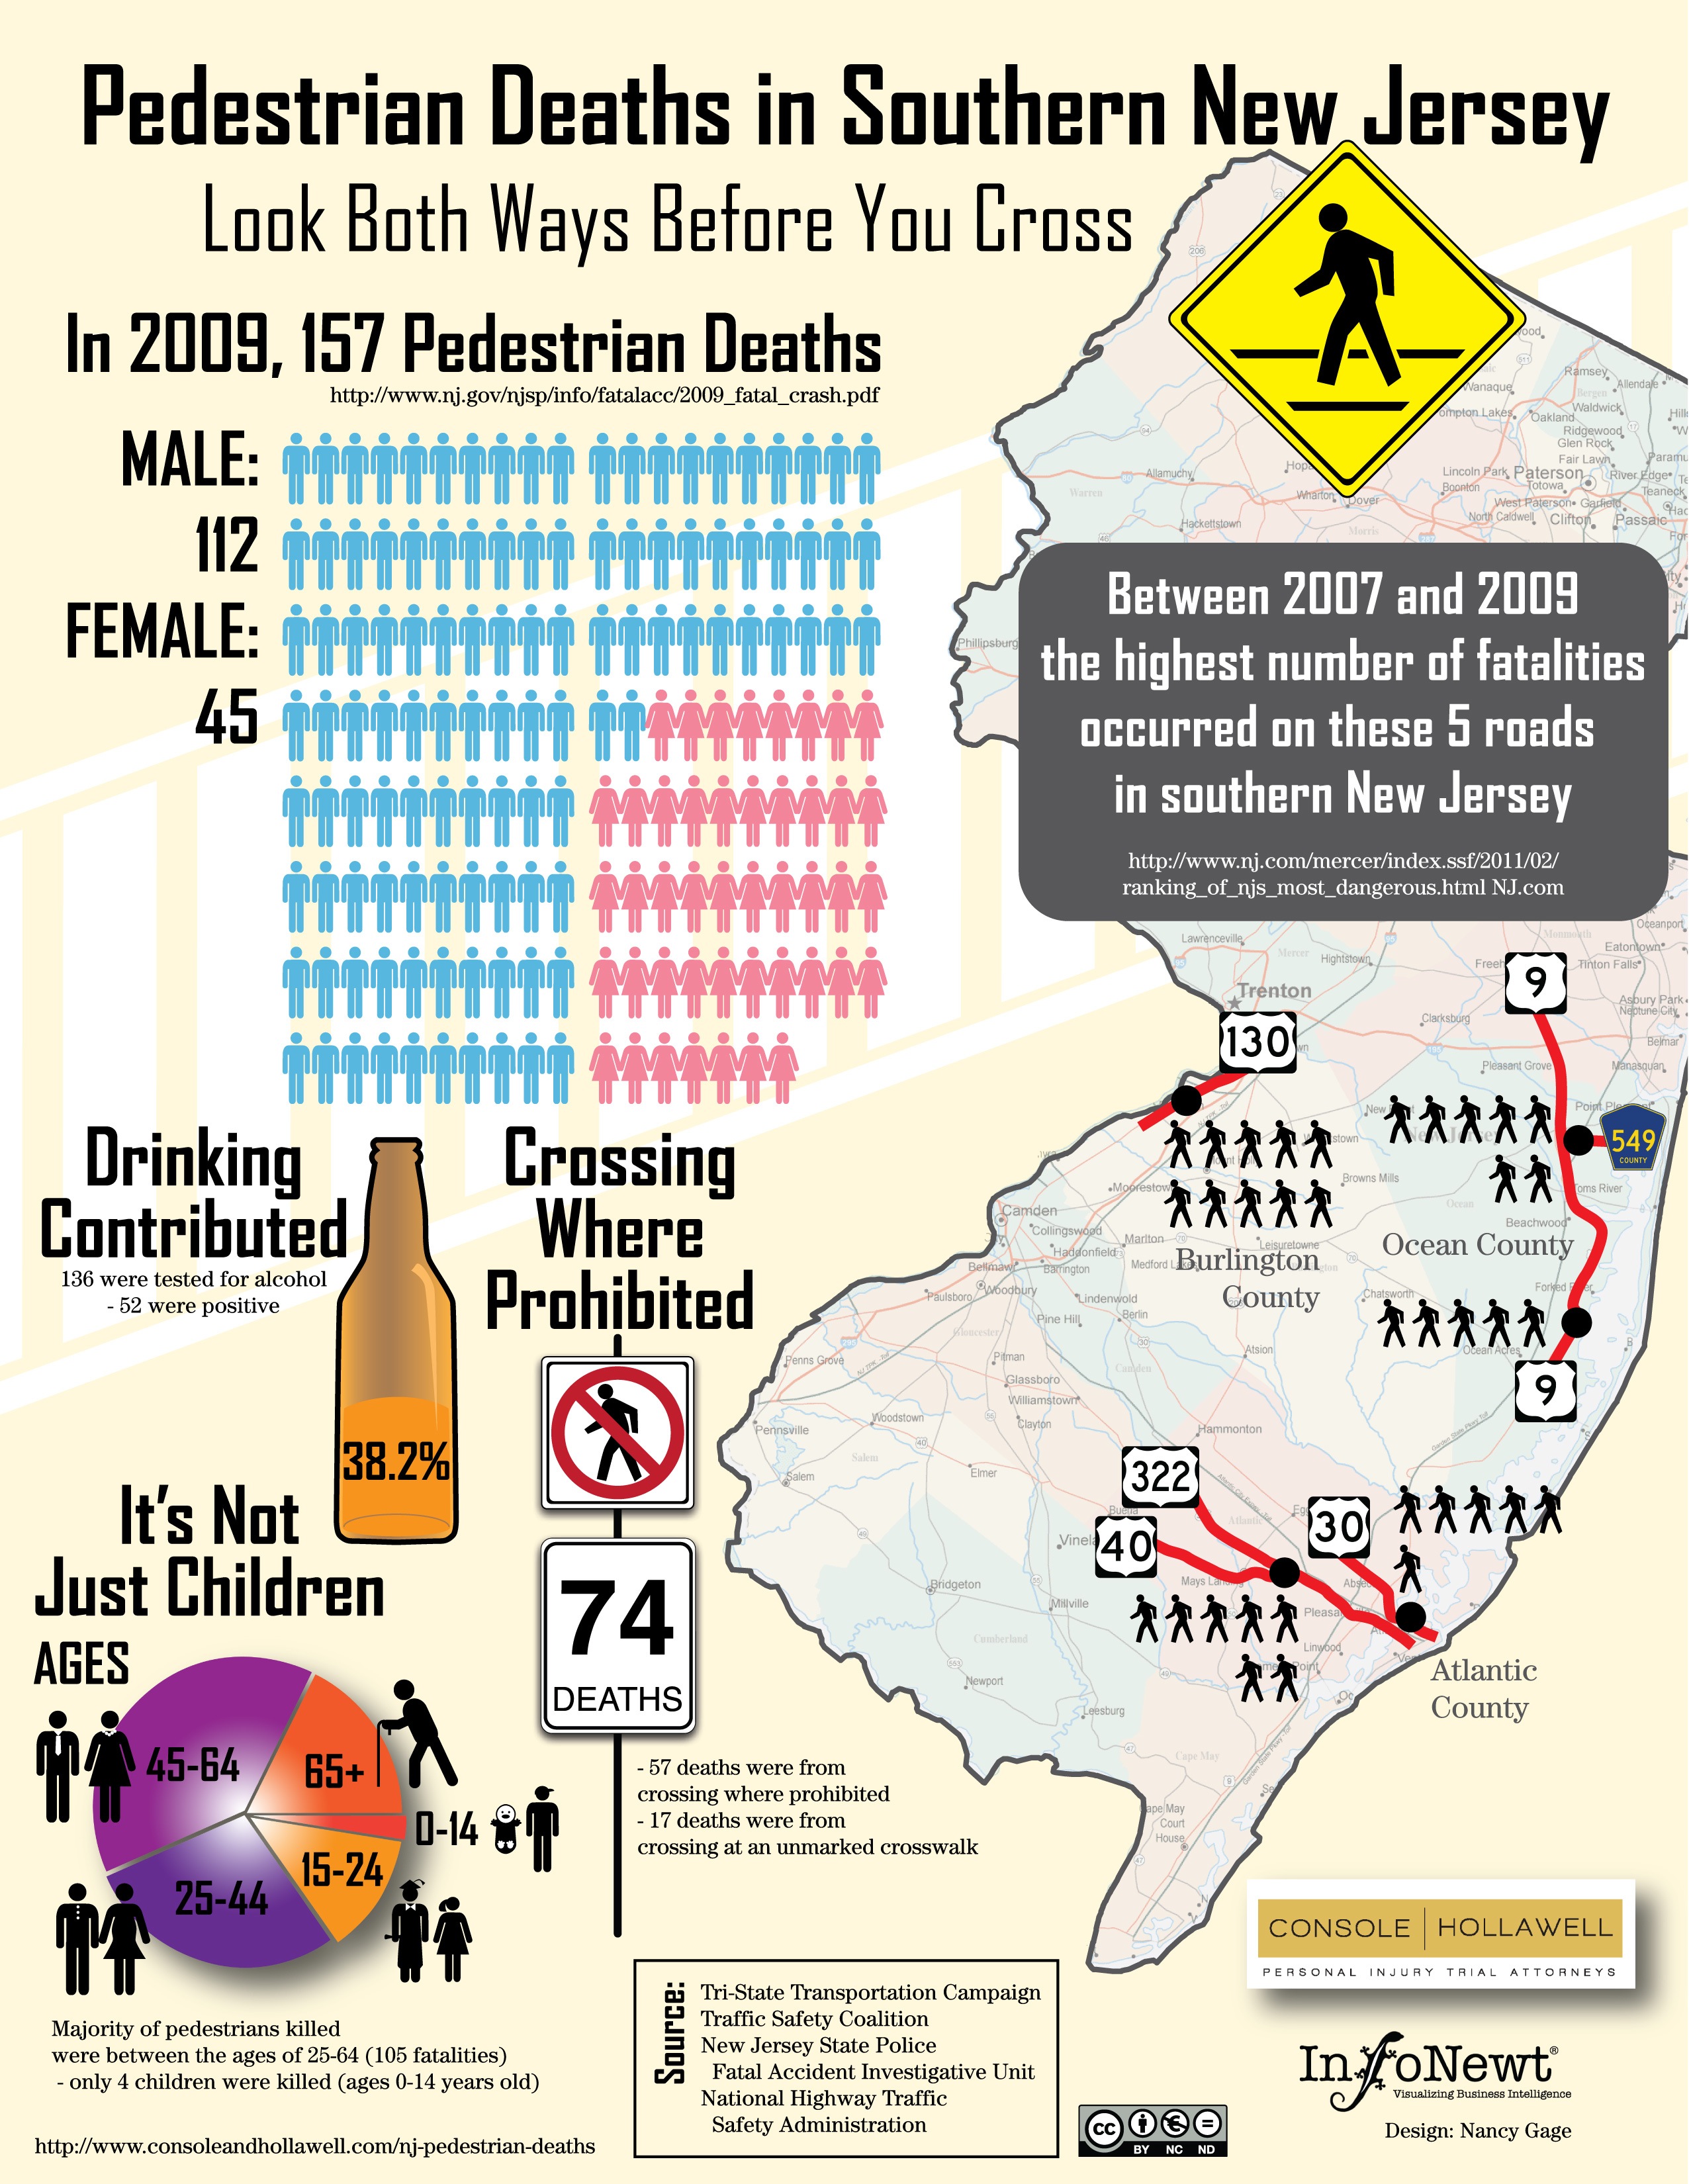
Client Infographic: Look Both Ways Before You Cross


Pedestrain Deaths in Southern New Jersey takes an infographic look at some usually inacessible and hard-to-find data from the different state department websites.  Console & Hollawell worked with InfoNewt and designer Nancy Gage to bring the data together into one infographic that tells a more complete story.

The New Jersey personal injury lawyers at Console & Hollawell receive calls on a daily basis from the unfortunate victims of car accidents across New Jersey and Pennsylvania. We are actively pursuing lawsuits in several cases. In an effort to bring attention to these dangers in New Jersey, we created the infographic below to help bring these statistics to light and ultimately help pedestrians maintain more awareness when crossing these dangerous New Jersey streets.

Although child deaths while crossing the street are the events that get the big headlines in the news, I was surprised that only 4 of the 157 deaths were kids.