About
Randy Krum
President of InfoNewt.
Data Visualization and Infographic Design

Infographic Design

Infographics Design | Presentations
Consulting | Data Visualizations

DFW DataViz Meetup

Join the DFW Data Visualization and Infographics Meetup Group if you're in the Dallas/Fort Worth area!

Search the Cool Infographics site

Custom Search

Subscriptions:


Feedburner

The Cool Infographics® Gallery:

How to add the
Cool Infographics button to your:

Cool Infographics iOS icon

- iPhone
- iPad
- iPod Touch


Read on Flipboard for iPad and iPhone

Featured in the Tech & Science category

Flipboard icon

Twitter Feed
From the Bookstore

Caffeine Poster

The Caffeine Poster infographic

Entries in Data (85)

Monday
Oct242011

Carbonite Small Business Disasters

Infographics as advertisments have a lot of potential.  In this one about Small Business Disasters, Carbonite.com has shared the results of research they performed with small businesses.

What would your small business do if your computers were stolen or destroyed? Would your important data still exist? In April, Carbonite surveyed small businesses with between two and 20 employees to study their disaster recovery and data backup methods. We found that almost half of small businesses have already lost irreplaceable data.

The design does suffer a little from the large-font-syndrome that tries to make the numbers really large instead of visualizing them, but there are a number of good, simple visualizations included in the infographic.

The design also seems like something is missing at the top.  No title, company logo or anything to indicated what this infographic is about.  That’s espeically important because infographics can be heavily shared and have a life of their own on the Internet, separate from any text or explanation that the origianl company posts along with it.

I will say that I LOVE Carbonite as a customer!

Wednesday
Jul272011

The VIZoSPHERE - Visualizing DataViz People on Twitter

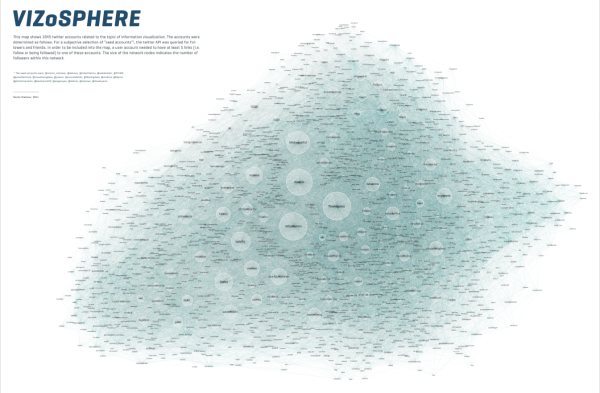
From Moritz Stefaner on Visualizing.org, comes the VIZoSPHERE project (Click the image to see the high-resolution image viewer).  Using GePhi, Moritz started with 18 seed accounts on Twitter, and then mapped 1,645 of the connected, networked accounts that relate to data visualization.  Bubble size in this visualization shows how many followers each account has from within this DataViz pool of users.

This map shows 1645 twitter accounts related to the topic of information visualization. The accounts were determined as follows: For a subjective selection of “seed accounts”[1], the twitter API was queried for followers and friends. In order to be included into the map, a user account needed to have at least 5 links (i.e. follow or being followed) to one of these accounts. The size of the network nodes indicates the number of followers within this network.


[1] The seed accounts were; @moritz_stefaner, @datavis, @infosthetics, @wiederkehr, @FILWD, @janwillemtulp, @visualisingdata, @jcukier, @mccandelish, @flowingdata, @mslima, @blprnt, @pitchinteractiv, @bestiario140, @eagereyes, @feltron, @stamen, @thewhyaxis

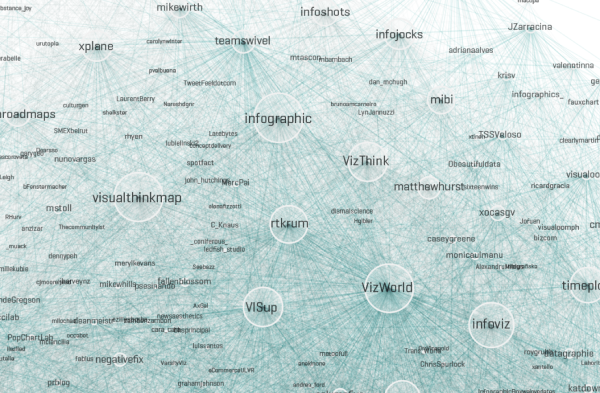
The zooming interface is crucial to view such a highly-detailed visualization and be able to read any of the nodes.  I was about to find my own Twitter account (@rtkrum), but it would be nice if Moritz would also provide a listing of the Twitter accounts or some way to search the map.

Great job Moritz!

Found on FlowingData and Robin Richards (@ripetungi) on Twitter.

Monday
Jun062011

DataVis Contest from Postgrad and David McCandless

Postgrad.com is sponsoring a data visualization contest using data gathered by David McCandless.  There’s a brand new iPad2 for the winner, and the top 3 will receive signed copies of ‘Information is Beautiful’ by David McCandless.


It Started With A Tweet…

Data journalist and information designer, David McCandless recently gathered data revealing surprisingly low numbers of black students accepted into Oxford and Cambridge.  However, despite being genuinely passionate about the data, David didn’t have time to visualise it himself.  So he posted the following message on Twitter…

We contacted David and offered to put up a prize as a competition for the best visualisation of this data. To our delight, David accepted our offer.

Like David, we feel strongly that this data should be made visible to many. And we’re challenging you to do it.

UPDATE:  Although the initial findings related to the number of black students, there’s a lot of information within the datasets about the ethnic heritage, and socioeconomic background of students attending different institutions.  You are free to pick out whatever story you wish and present it in a visual format.

Enter Now To Win…

It’s easy to enter the competition and you could win:

  • Recognition from our panel of industry experts in journalism, data visualisation and design
  • Your name and work promoted across the web
  • A proud and noteworthy addition to your portfolio, website or CV
  • A full post profiling you and your work, and the design process you followed
  • A signed copy of Information is Beautiful by David McCandless
  • A brand new iPad2

Expert Judges From The BBC, .net Magazine And More…

Assisting David in the judging, we are thrilled to have judges from the BBC, .net Magazine, Tableau Software, Visualising Data, and marketing agency 97th Floor.

The judges will consider a range of criteria including design, effective visualisation, and presentation of the story.

  • Andy Kirk, Founder, Visualising Data Ltd
  • Chris Bennett, President, 97th Floor
  • David McCandless, Author, Information is Beautiful
  • Elissa Fink, VP Marketing, Tableau Software
  • Katherine Mann, Director, Postgrad.com
  • Rob Bowen, Art Editor, .net Magazine
  • Russell Smith, Editorial Development, BBC News

It’s An Open Brief

The competition is based on the data collected by David, and other sources listed within the dataset.  However, you are free to mashup the data with any other source you wish, provided the sources are publicly available and cited in your entry to the competition. 

Your visualisation can be static, moving or interactive

You can include as little or as much text as you like

It can be as simple as a single chart or a full-blown infographic

You’ve A Good Chance of Winning…

People are often put off entering competitions assuming there will be hundreds of entrants. In reality, this is rarely the case. Simply entering really could put you in the running for a prize. 

There’s a brand new iPad2 for the winner. And the top 3 will receive signed copies of ‘Information is Beautiful’ by David McCandless.

Entries from amateurs and newbies are very much welcome. We’d love to see what you come up with.

Remember, it doesn’t have to be a masterpiece. A simple yet effective piece of visualisation could be just the ticket.

And all highly recommended pieces, will receive recognition by our expert panel alongside the winners when results are announced.

Remember The Important Stuff

The competition rules are posted here.

You can grab the data here (be sure to check out the other sources listed within it).

To enter the competition, simply email your visualisation as a jpeg attachment to mark.johnstone@postgradsolutions.com and include your Full Name and the best email address to reach you on. As an alternative to sending your entry as an attachment, you are welcome to post your entry on your own site, and simply send us the link. In fact, we’d love it if you did that.

If your entry is interactive or moving, you will have to publish it on a separate site (your own site is preferable but social sites like YouTube are perfectly acceptable). Just remember to send us the link.

The competition closes at 11pm GMT on Monday 20th June 2011.

Winners will be announced by Monday 4th July 2011.

The Datasets

You can find the data collected by David McCandless here.

You may also find the following resources useful:

Guardian DataBlog post on Oxbridge Elitism

UCAS Annual Datasets

And Remember, the Competition Closes at 11pm GMT on Monday 20th June 2011.


Wednesday
Jun012011

Artfully visualizing our humanity: Aaron Koblin's TEDTalk 

In March 2011, Aaron Koblin, Creative Director of Google’s Data Arts team, gave a good TEDTalk presentation, Artfully Visualizing our Humanity, looking at a number of his visualization projects, and how visualizing data is becoming our interface to large datasets.

Artist Aaron Koblin takes vast amounts of data — and at times vast numbers of people — and weaves them into stunning visualizations. From elegant lines tracing airline flights to landscapes of cell phone data, from a Johnny Cash video assembled from crowd-sourced drawings to the “Wilderness Downtown” video that customizes for the user, his works brilliantly explore how modern technology can make us more human.

Found on FlowingData.com and Infosthetics.com

The video is now also available on YouTube:

Wednesday
May252011

Apple Approves 500,000 Apps...and counting


To celebrate Apple (unofficially) reaching the 500,000 apps milestone, 148Apps, Chillingo and Chomp got together to create an infographic.  The 500,000 Apps infographic uses a cool blend of visual styles to explore the history of Apple’s App Store.

Early this morning, Apple approved app number 500,000.  For that, we salute the hard working developers and the enthusiastic community of app seekers (you!).

Because Chomp wouldn’t be here without all of these glorious apps plus our amazing community of app seekers, we’ve put together an infographic highlighting an array of app milestones along the way, including apps you’ve loved since the beginning.

Pie chart, timeline, bar chart, area chart, doughnut chart, stacked area chart and plain old BIG NUMBERS combine together to tell the story of the Apple App Store.

I’m disappointed that the data sources aren’t listed on the infographics.  That opens up the discussion to challenge the numbers and the validity of the overall infographic.

Cool design by Stefanie Kraus (@stefaniekraus)

Three cheers for Team Chomp member, Stefanie, who is responsible for ‘beautifying’ all of the 150+ data points into what is now being dubbed the longest (and most stunning) infographic you may ever see. 

Don’t worry Stefanie, I’ve seen LONGER infographics…


Found on The Unofficial Apple Weblog

Monday
May022011

The Real Cost of Dating

This is a pretty simple one, but I appreciate when companies are willing to experiment with infographics and even design their own.  The Real Cost of Dating is from Match.com and based on a survey they performed in March of 2011.  So here, the company is putting their own, proprietary data out on the web to inform readers and draw them into the match.com blog.

First, I like the talk bubble used as a pie chart.  It really helps reinforce the data as “Men say…”, “Women say…”.  Although I think the design is too subtle.  It took me a minute to even see that there were too colors in the bubbles.

Persoanlly, I think this design is very text-heavy, and much of the text is redundant.  For example, each statistic includes the text “…of women” when they are already in a section of the infographic of just statistics from women.

Overall, good first swing at using infographics in your marketing strategy, and I hope they do more.

Thanks to Colin for sending in the link!

Thursday
Apr212011

Easter by the Numbers #infographic


A fun infographic from DegreeSearch.org, Easter by the Numbers takes an amusing look at chocolate Easter bunnies and other candy during the Easter holidy.

Here in the United States, we eat soooo much candy at Easter. Delicious chocolate eggs, chocolate bunnies, Peeps, jelly beans and more. It doesn’t take a healthcare degree to figure out what all that candy means for our bodies. If you want to keep the pounds off, stay away from the basket. But if you don’t care about the pounds, try the Cadbury Mini Eggs. Mmmm, delicious.

Can you find all 18 chocolate Easter bunnies in the infographic?

Thanks to Matt for sending in the link!

Tuesday
Apr122011

The Current State of Social Networks #infographic

From ignite, a social media agency, comes The Current State of Social Networks.

It goes without saying that Facebook is the network du jour, but even though the reigning champion’s user stats keep soaring, social networking as a whole might be leveling off. Nevertheless, there are still scores of other highly competitive social sites that are waxing and waning; and different networks and apps are more popular in specific geographic areas, with certain genders or age groups, and even among various social classes.

For example, Plaxo is the network with the most users over the age of 65. Facebook is more popular with women, but Digg and Reddit tend to be more popular with men. LinkedIn is the “richest” social network, but Plurk outranks it when it comes to well-educated users who have graduate degrees.

They have a ton of traffic data to work with, and this infographic does a good job of summarizing some of the key findings at the top level. 

Found on Mashable and Social Media Graphics

Friday
Apr012011

Microsoft's Growth of Mobile Marketing

I love to see the big companies experimenting with new media like infographics!  The Growth of Mobile Marketing and Tagging was published by Microsoft Tag last week, and explores the data behind mobile devices.

Sure, it seems like everyone’s got a cell phone – but what are the hard numbers? How many people have smart phones, and what demographic is the most active group in mobile socialization? (Surprise — it’s actually not teenagers!) Find out the statistics on the present (and future!) of mobile marketing in our new infographic

They also broke the graphics down into individual pieces (roughly) and created a presentation version for anyone that wants to use it on SlideShare:


Thanks Elliott for send me a link!

Wednesday
Mar232011

Japan: The Earthquake & The Tsunami [infographic]

Japan:The Earthquake & The Tsunami is a good infographic design from the team at DigitalSurgeons.com.  I like the simple color scheme, and the mix of different types of visuals for the different pieces of data.  Maps, bar charts, icon grids and a ruler all help put the currently available information into perspective.

The bottom also lists some of the major support links for people that would like to help.

Thanks to Peter for sending in the link!