About
Randy Krum
President of InfoNewt.
Data Visualization and Infographic Design

Infographic Design

Infographics Design | Presentations
Consulting | Data Visualizations

DFW DataViz Meetup

Join the DFW Data Visualization and Infographics Meetup Group if you're in the Dallas/Fort Worth area!

Search the Cool Infographics site

Custom Search

Subscriptions:


Feedburner

The Cool Infographics® Gallery:

How to add the
Cool Infographics button to your:

Cool Infographics iOS icon

- iPhone
- iPad
- iPod Touch


Read on Flipboard for iPad and iPhone

Featured in the Tech & Science category

Flipboard icon

Twitter Feed
From the Bookstore

Caffeine Poster

The Caffeine Poster infographic

Entries in review (4)

Friday
Apr152016

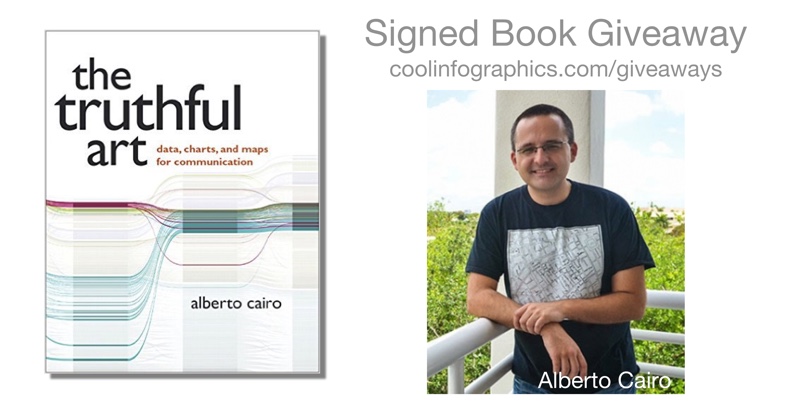
The Truthful Art by Alberto Cairo: Interview & Giveaway

The Truthful Art is the newest book by Alberto Cairo, and the second book of a longer, planned series. Following the huge acclaim and success of his last book, The Functional Art, Alberto expertly dives into getting data visualizations both accurate and designed for effective communication. 

This month I am giving away one signed copy of The Truthful Art! Register on the Giveaways Page by April 30th to be entered.

The Truthful Art explains:

• The role infographics and data visualization play in our world

• Basic principles of data and scientific reasoning that anyone can master

• How to become a better critical thinker

• Step-by-step processes that will help you evaluate any data visualization (including your own)

• How to create and use effective charts, graphs, and data maps to explain data to any audience

Alberto Cairo is the Knight Chair in Visual Journalism at the University of Miami, where he teaches courses on infographics and data visualization. He is also director of the Visualization program of UM's Center for Computational Science, and Visualization Innovator in Residence at Univisión, besides being a consultant for several tech companies. He is the author of the books The Functional Art: An Introduction to Information Graphics and Visualization (2012) and The Truthful Art: Data, Charts, and Maps for Communication (2016).

Everyone should follow Alberto Cairo on Twitter (@albertocairo)! He is one of the most vocal dataviz experts online, and shares his wisdom and insights openly. Also, you can download a sample of the new book with the first 40 pages of the book available on Google Drive.

I sent Alberto a handful of questions about The Truthful Art:

Who is the book intended for?

In the Epilogue I joke that I wrote 'The Truthful Art' for my past self, 8 or 10 years ago. As a journalist and designer, I didn't receive appropriate training in data reasoning in college, and that led me to make many mistakes in my career. The book is for communicators of any kind (journalists, graphic designers, marketing folks) who need to deal with data on a regular basis. It's certainly a book about data visualization and infographics, but it also covers the steps that come before you start designing anything: Getting your information as right as possible.

How do you define the difference between a visualization and an infographic?

In the book I explain that the boundary between these and other genres is very fuzzy. For me, an infographic is a combination of words and visuals (charts, maps, diagrams, illustrations) that makes a certain story understandable for people. The designer decides what data to show, and how to structure it, sometimes as a narrative or story. A data visualization doesn't necessarily tell a story, but it enables people to come up with their own conclusions, by letting them explore the information. Infographics emphasize explanation, data visualizations emphasize exploration.

What does it mean for a visualization to be truthful?

The whole book deals with this topic. In general, it requires a proper, honest, and thorough exploration of your information; asking people who know more than you do about it; and then a proper choice of visual forms to represent it.

Why are we more likely to accept visual information as truth?

It's not just visual information, it's any kind of information. We human beings aren't skeptical by nature. Our default is belief.

It is only when we become aware of the multiple ways our own brain, and other people, can trick us that we begin questioning what we see, read, hear, and feel. It is true, though, that recent research has shown that visualizations make messages more credible; this is something that can be used for good or for evil.

I don't know why many of us tend to take visualizations at face value, but it may have to do with the fact that most of us unconsciously associate charts and data maps with science. Those graphics look so precise, so crisp, so elegant! They must be accurate and truthful, right? --Well, perhaps not!

How difficult is it to choose the right chart style?

Not that difficult if you think about the message that you want to convey, or the tasks you want to enable, instead of relying just on your personal aesthetic preferences. I love maps, and I wrote an entire, long chapter about them for the book, but that doesn't mean that everything should be a map. A map may give you certain insights, but may also obscure others. In many cases, a chart may be better.

How can we become better skeptics and critical thinkers when we see data visualizations?

The key is to remember a maxim that I repeat in the book: A visualization is not something to be seen, but something to be read. Approach data visualizations and infographics not as beautiful illustrations (although beauty is a very important feature) to be looked at quickly, but as visual essays. Read them carefully, ask yourself if the designer is showing everything that needs to be shown. Remember that a single number or variable means very little on its own. In infographics, context is everything, and comparisons are paramount.

Is complexity the enemy of good data visualization design?

Far from it. Many designers believe that data visualizations and infographics are intended to “simplify” data. As my friend, the designer Nigel Holmes, has repeatedly said, infographics shouldn't simplify, but clarify. Clarification in some cases means reducing the amount of information you present, but in many others it requires you to increase it. In the book I show some examples of graphics that fail because their designers reduced the data so much that they rendered it meaningless. If a story is complex, its representation will necessarily be complex as well.

This said, it is good to be reminded of that old maxim commonly attributed to Einstein: Everything should be as simple as possible, but not simpler. Over-complicated visualizations are also problematic. If your message is simple or trivial, why creating an extremely intricate graphic?

What’s available for readers on the book website: http://www.thefunctionalart.com/p/the-truthful-art-book.html?

For now, www.thefunctionalart.com contains my blog, contact information, information about both books, and some other resources. I have added software tutorials, and will soon post some of the data from the book. My professional website, http://www.albertocairo.com/, which will be launched soon, will contain more resources.

Are you speaking at any upcoming presentations or webinars?

Yes. I post most of my speaking engagements and consulting gigs here: http://www.thefunctionalart.com/p/speaking-schedule.html

Where’s the best place to follow you online?

My blog and Twitter. I use Twitter (@albertocairo) to take notes for myself, and save interesting resources, so if you want to see what I see or read what I read, that's the place to go!


Thursday
Mar312016

A New Visme: Huge Update to the Online Design Tool

The new Visme is here. Following eight months of dedicated work to address more than 30 user requests, Visme now gives its users an even smoother workflow. By improving user experience, development infrastructure, and scalability, the new Visme enables faster deployment and increased productivity with a familiar interface.

Of course, the best way for a design platform like Visme to share the new features is with an infographic designed using their own tool! You can see the infographic and all of the update features in this Visme blog post.

If you're not already familiar with Visme, it's an easy-to-use online visual content editor that allows you to create stunning presentations, reports, infographics, interactives, and more. Used by designers worldwide as their vector design platform that replaces the need for traditional software apps like Adobe Illustrator or Microsoft PowerPoint. With Visme, you can visualize stories and data, which is why it’s trusted by 300,000+ marketers, communicators, executives, educators, and nonprofits from 50+ countries.

With the upgraded Visme, you can:

  • Produce an alluring narrative with the revamped text editor and updated text widgets. Custom styling and padding, along with a spread of lively fonts, give your words an illustrative charm that bounces off the screen, transforming dull text blocks into something to see.

  • Move multiple objects and copy to them to slides to reorganize your story without hassle. No need for tedious work when you can duplicate and tweak rather than constantly starting anew or pasting too much and working backwards.

  • Create a global color palette to guarantee consistency throughout a complex project. This allows you to keep track of colors in a visual language in order to design quicker without guesswork or extra steps.

  • Choose from millions of free images to present a more striking take on your content. Don't spend hours online looking for the right picture and if you can even use it. Brighten up your work with ease and efficiency to grab your audience's attention without entering a labyrinth.

  • Record audio, upload your own or choose from a collection of high-quality music clips to strengthen a presentation with a narration or background music. Audio gives your content an extra level of exciting depth. Manage timing and fade control from one intuitive panel.

  • Expand your data storytelling tactics with new chart types and a selection of thousands of adjustable vector shapes and icons. Go far beyond standard and avoid being repetitive with new data visualization capabilities. You can even make them animated.

  • Get started quickly with a vastly expanded library of templates and themes, tailored for specific industries and purposes. You'll have the right look for exactly what you're doing.

I recently had the opportunity to interview Visme Founder Payman Taei in this webinar for Visme members, where he also demonstrated the new capabilities of the updated Visme design platform:

It's time to step up your game and make your presentations and infographics more impactful and effective. Try Visme for FREE, and when you're ready to subscribe, use the discount code VISME30 for 30% OFF for the lifetime of your account!

Monday
Jan252016

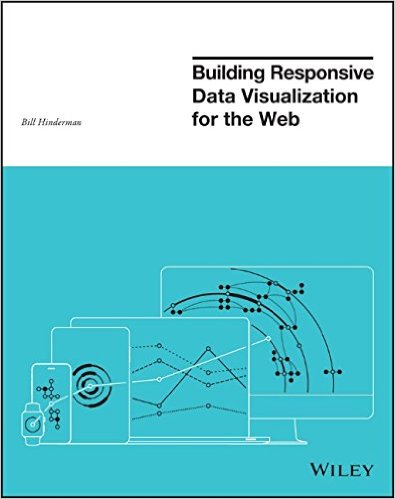
Building Responsive Data Visualization for the Web

Building Responsive Data Visualization for the Web book cover

Building Responsive Data Visualization for the Web by Bill Hinderman is a new book that just came out in November. I had the pleasure of helping Bill as the Technical Editor on the book last year, and I can say it's a fantastic guide to structuring your data and building your code for interactive data visualizations that work perfectly on every screen size.

January Giveaway! This month I am giving away one signed copy to a randomly chosen winner. Register on the GIVEAWAYS page by 11:59pm CT on January 31, 2016 to be entered. A winner will be randomly selected on February 1st.

Data is growing exponentially, and the need to visualize it in any context has become crucial. Traditional visualizations allow important data to become lost when viewed on a small screen, and the web traffic speaks for itself – viewers repeatedly demonstrate their preference for responsive design. If you're ready to create more accessible, take-anywhere visualizations, Building Responsive Data Visualization for the Web is your tailor-made solution.

Building Responsive Data Visualization for the Web is a handbook for any front-end development team needing a framework for integrating responsive web design into the current workflow. Written by a leading industry expert and design lead at Starbase Go, this book provides a wealth of information and practical guidance from the perspective of a real-world designer. You'll walk through the process of building data visualizations responsively as you learn best practices that build upon responsive web design principles, and get the hands-on practice you need with exercises, examples, and source code provided in every chapter. These strategies are designed to be implemented by teams large and small, with varying skill sets, so you can apply these concepts and skills to your project right away.

Responsive web design is the practice of building a website to suit base browser capability, then adding features that enhance the experience based on the user's device's capabilities. Applying these ideas to data produces visualizations that always look as if they were designed specifically for the device through which they are viewed. This book shows you how to incorporate these principles into your current practices, with highly practical hands-on training.

  • Examine the hard data surrounding responsive design
  • Master best practices with hands-on exercises
  • Learn data-based document manipulation using D3.js
  • Adapt your current strategies to responsive workflows


I asked Bill to answer a few questions about his book:

Who is the book intended for?

The book is for a development and design team that is looking to shift toward responsive, mobile-first practices.  While it's certainly geared most toward data visualization projects, the book spends a hefty amount of time building responsive design tenets before then getting specifically into visualization.


What’s the most important thing to make a great data visualization?

In my mind, the most important thing in making a great data visualization is the output being actionable.  The goal of a visualization is always to make something more clear, right?  All of the data is already...there, in its raw form.  So the initial goal, the more achievable goal, is clarity. But making something clear, and then also making it actionable - that is - pushing the reader/viewer/user toward actually doing something with the data, is where greatness shows up.


Do you see everyone moving towards responsive data visualization, or are a lot of companies holding back?

No, I actually don't.  I see a huge amount of people holding back, really with the same reasoning that plagued responsive design in its early stages.  That being: "People don't want to do that on mobile."  Which is, quite frankly, ridiculous.  Every study Pew has put out (I reference plenty of them in the book) shows that as soon as someone is given the opportunity to do something on mobile, they do it.  Moreover, there's an increasing amount of mobile-only users, rather than simply mobile-first.  Very soon, desktop users are going to be seen as an antiquated, legacy type of use case, rather than the default.


What's the difference between Responsive Data Visualization and Responsible Data Visualization?

Responsive data visualization is the practice of building data visualizations in such a way that they adapt, respond to, and feel natural regardless of whatever device type a user is accessing them with, and whatever the data set looks like.  In this way, it is the responsible way to visualize data.  So...there isn't one, I suppose.


What do you mean in the book by “Think Small”?

So a concept that's very closely tied to responsive design is thinking mobile-first.  That is: designing first for your most limited use case: a small screen, a bad network, sloppy, finger-based gestures.  In data visualization, we actually have an even more limited use case: no screen at all.  That's where building a good API comes into play.  Thinking of the smallest, most limited use case, say, an external call to your API from a different website, and building toward that first.  That way, as you gain real estate, features, bandwidth, you are simply enhancing something that already has a great foundation.


What are your thoughts on D3.js and its future?

It's the best, and I love it and if I could, I would shower it with chocolates.  D3.js is, if you're able to devote a development resource to learning it, the absolute best way to create a visualization on the web, because it uses all the languages of the web.  Because it isn't some applet, or some plugin, or some...image, I suppose, it just works intuitively like you are building normally for the web.  Because of this, I think the future is bright.  Even if it were never to be updated again (which isn't the case), it would still implicitly grow in functionality as web languages evolve and grow around it.


What’s available for readers on the book website: http://responsivedatavisualization.com/?

The website has snippets from every chapter of the book, along with exercises and code samples that go along with the practice sections in the chapters.  All of the code links to GitHub, and can be forked, built locally, and compared with solutions.


Are you speaking at any upcoming presentations or webinars?

I am!  I'll be speaking at Strata + Hadoop World San Jose in March (http://conferences.oreilly.com/strata/hadoop-big-data-ca).


Where’s the best place to follow you online?

The best places to follow me online are my own website (billhinderman.com), LinkedIn (linkedin.com/in/williamHinderman), or Twitter (twitter.com/billHinderman).


Tuesday
Jun162015

Visme 3.0 Design Platform Launches Improved User Interface

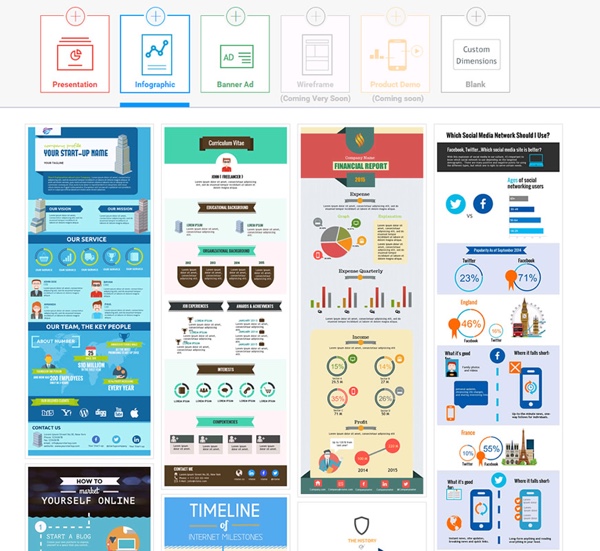
Visme Infographic Templates

Visme is an online design platform, and can be used to create infographics, presentations, banners, reports, and even resumes. With over 200,000 users, Visme is being used by many as a replacement for expensive desktop applications like Microsoft PowerPoint and Adobe Illustrator.

"Visme epitomizes everything we strive for. At the core we are a visualization tool and our mission is to simplify the ability for anyone to easily transform their thoughts and ideas into engaging visual content," - Founder Payman Taei

In April 2015, the team at Hindsite Interactive launched Visme 3.0, a complete redesign, moving to a cleaner, easy-to-use user interface. The redesign has made a major move towards flatter design elements that help users focus on the content they are creating without being distracted by the interface tools.

Visme Flat Design Interface Updates

If you’re not a professional designer that can invest in a high-end hardware and software setup or don’t have the time or budget to hire a professional, Visme is a great platform to create eye-catching visual content with minimal effort. You can start with one of the many professional templates, and then customize your design by changing colors, rearranging the layout, uploading your own images, inserting video, building simple data visualizations using the Graph Tool, or use any of the millions of free icons and images from the huge built-in library.

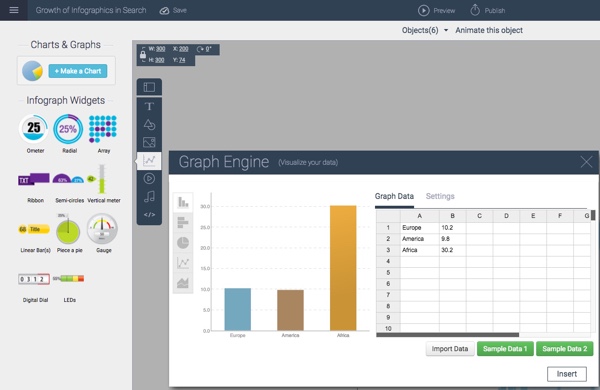
Specifically for infographics design, the built-in Graph Tool and Infograph Widgets can be very helpful. Although you may import more complex data visualizations created elsewhere, the Graph Tool let’s you build simple charts directly in your design by entering the data and editing the chart settings. This is a huge advantage over many other online design tools that only provide chart shapes and objects that you have to adjust manually to match your data. Accuracy of your data visualizations in an infographic is crucial!

Visme Graph Tool

Here you can see a simple area chart created with the Visme Graph Tool. Over 600 data points were uploaded to create this simple data visualization. Because it was built with the Graph Tool, the chart is editable as the data set continues to grow in the future. The design has been inserted here using the embed code created by the Visme platform to display the chart. As future updates are made to the chart on the Visme site, the most current version will always be displayed here. For infographics, you can update the data in your design, and every site that uses the embed code will always display the latest version of your design.

Original: http://my.visme.co/projects/growth-of-infographics-in-search-613ce1

 Personally, I’d like to see the Graph Tool expand into more visualization styles, and give the users more ability to customize the charts it creates. It’s pretty good with the simple charts, but I hope this is only the starting point for the Visme team. I hear that improvements to the Graph Tool are in the plan for release later this year.

Infographics are made to be shared, and the Visme tool gives you plenty of options. In addition to embed code for both animated and static sharing, you can also download your design as a static image file (JPG or PNG) or a PDF file for easy distribution.    You can also download as HTML5 version which would retain all interactivity of your live version and open locally in any browser without third party software or plugins.

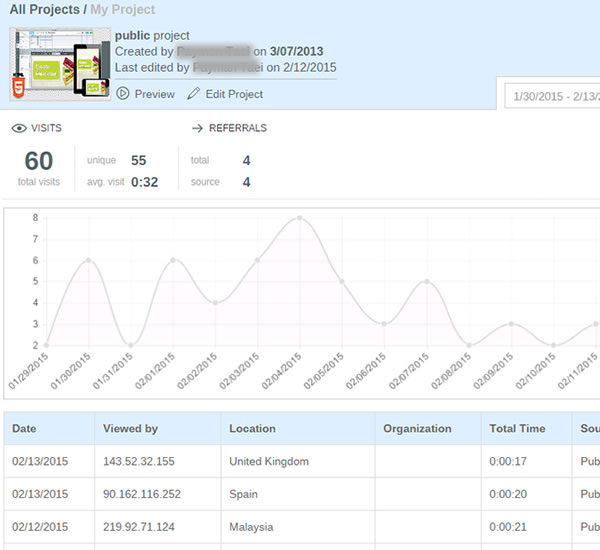
Two other advantages of designing your infographics in Visme. First, you can keep your designs private, and only allow those that have the link to view your design. You can even password protect your design so only those with the link and the password can view your design. Second, you can see the analytics for your design in one place. This is a real challenge for tracking infographics online, and seeing the combined statistics of views and visits to your infographic is a fantastic feature. For everyone that shares your infographic on their own using the embed code, those viewer statistics are all gathered together in your Visme analytics dashboard.

Visme Analytics


Visme is free to everyone to try with many of the basic design tools. Paid plans start at just $6/month to unlock premium templates, along with the ability to manage privacy, download content, analytics and collaboration tools.

Special for readers of Cool Infographics, use the discount code VISME3 to get a lifetime 25% discount on any subscription.