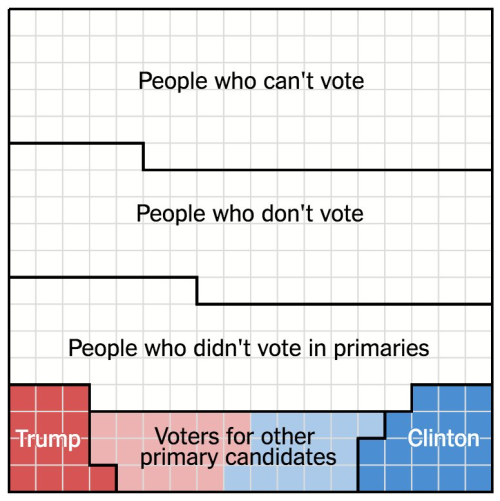
Very Few Americans Nominated Trump and Clinton
Designed by Alicia Parlapiano and Adam Pearce for the New York Times, this short series of data visualizations tell a very clear story about how Only 9% of America Chose Trump and Clinton as the Nominees For the 2016 Presidential election.
The United States is home to 324 million people. Each square here represents 1 million people.
103 million of them are children, noncitizens or ineligible felons, and they do not have the right to vote.
88 million eligible adults do not vote at all, even in general elections.
An additional 73 million did not vote in the primaries this year, but will most likely vote in the general election.
The remaining 60 million people voted in the primaries: about 30 million each for Republicans and Democrats.
But half of the primary voters chose other candidates. Just 14 percent of eligible adults — 9 percent of the whole nation — voted for either Mr. Trump or Mrs. Clinton.
Mr. Trump and Mrs. Clinton will be working to win the votes of these three groups. Polls suggest they will be separated by just a handful of squares.
If you follow the news headlines, you might think a majority of Americans are in favor of one of our two Presidential nominees, but that would be a misunderstanding of election and population statistics.
This is a fantastic example of storytelling with data, and walking the audience through the data insight step-by-step.
Found on FlowingData
 Data,
Data,  Story,
  election,
  population,
  presidential,
  statistics


Reader Comments (7)
- protection against unrepresentative governance https://en.wikipedia.org/wiki/Quorum
thanks sir