About
Randy Krum
President of InfoNewt.
Data Visualization and Infographic Design

Infographic Design

Infographics Design | Presentations
Consulting | Data Visualizations

DFW DataViz Meetup

Join the DFW Data Visualization and Infographics Meetup Group if you're in the Dallas/Fort Worth area!

Search the Cool Infographics site

Custom Search

Subscriptions:


Feedburner

The Cool Infographics® Gallery:

How to add the
Cool Infographics button to your:

Cool Infographics iOS icon

- iPhone
- iPad
- iPod Touch


Read on Flipboard for iPad and iPhone

Featured in the Tech & Science category

Flipboard icon

Twitter Feed
From the Bookstore

Caffeine Poster

The Caffeine Poster infographic

Entries in software (55)

Monday
Dec122011

Client Infographic: Top 20 Marketing Automation Software Solutions

Designed here at InfoNewt for Capterra, the new infographic: The Top 20 Marketing Automation Software Solutions explores the relative Popularity of different software companies playing in the Marketing Automation arena. 

In this design, I used a pie chart to represent the total Popularity of the Top 20 solutions, and connected the related company logo to each slice as appropriate.  It was a specific design choice to list the rank number, but not the specific percentage of each slice.  Because the data was gathered and combined from a number of different sources that can change daily, the results needed to be informational at a general level and valid for a longer period of time.  Visually, you can quickly and easily understand the relative popularity, but the specific value isn’t relevant to any purchase decisions.

An infographic product comparison is a great way to help buyers cut through the clutter and add value.  There are currently 184 software solutions listed in the Marketing Automation category directory, so buyers need some way to compare products and make an informed decision.

Capterra is the authority when it comes to finding software solutions for businesses, and they’ve done some great work gathering data and measuring the relative popularity of different software categories.  Although popularity doesn’t necessarily mean the software is right for your business, it is a really good indicator that the solution is working successfully for many businesses and may be worth a closer look.  A better indicator than just total revenue or trying to rate “the best.”

Designed in OmniGraffle, and I cleaned up the logo images using Pixelmator.

Thanks to Mike and the great work from the team at Capterra!

Thursday
Dec012011

The Designer's Toolkit: The Most Popular Design Tools

BestVendor.com recently released The Designer’s Toolkit, an infographic showing the results of a survey with 180 design professionals about the software they use to perform their magic.

What are the most popular tools and apps used by designers? We were curious, so we pulled together data based on 180 design and creative professionals who use BestVendor. Below is an infographic showing results across a range of product categories, from invoicing to wireframing. We also included a few design tools considered hidden gems and rising stars among this audience. One observation: Designers’ powerhouse tools like the Adobe Suite remain on the desktop, but more than half of their favorite apps are in the cloud.

Although 180 designers isn’t enough to be quantitative, statistically accurate results, I really like the overall design layout and the stacked bar style with the most used software on top of each chart.  Easy to read and compare between categories.  However, I don’t understand the color choices (shouldn’t they be related to each software brand color?), and I think it would have looked better with the application icons in the chart.

If you’re interested, you can see the software I use on BestVendor here.

Found on FastCo Design

Thursday
Sep222011

The Evolution of the Web


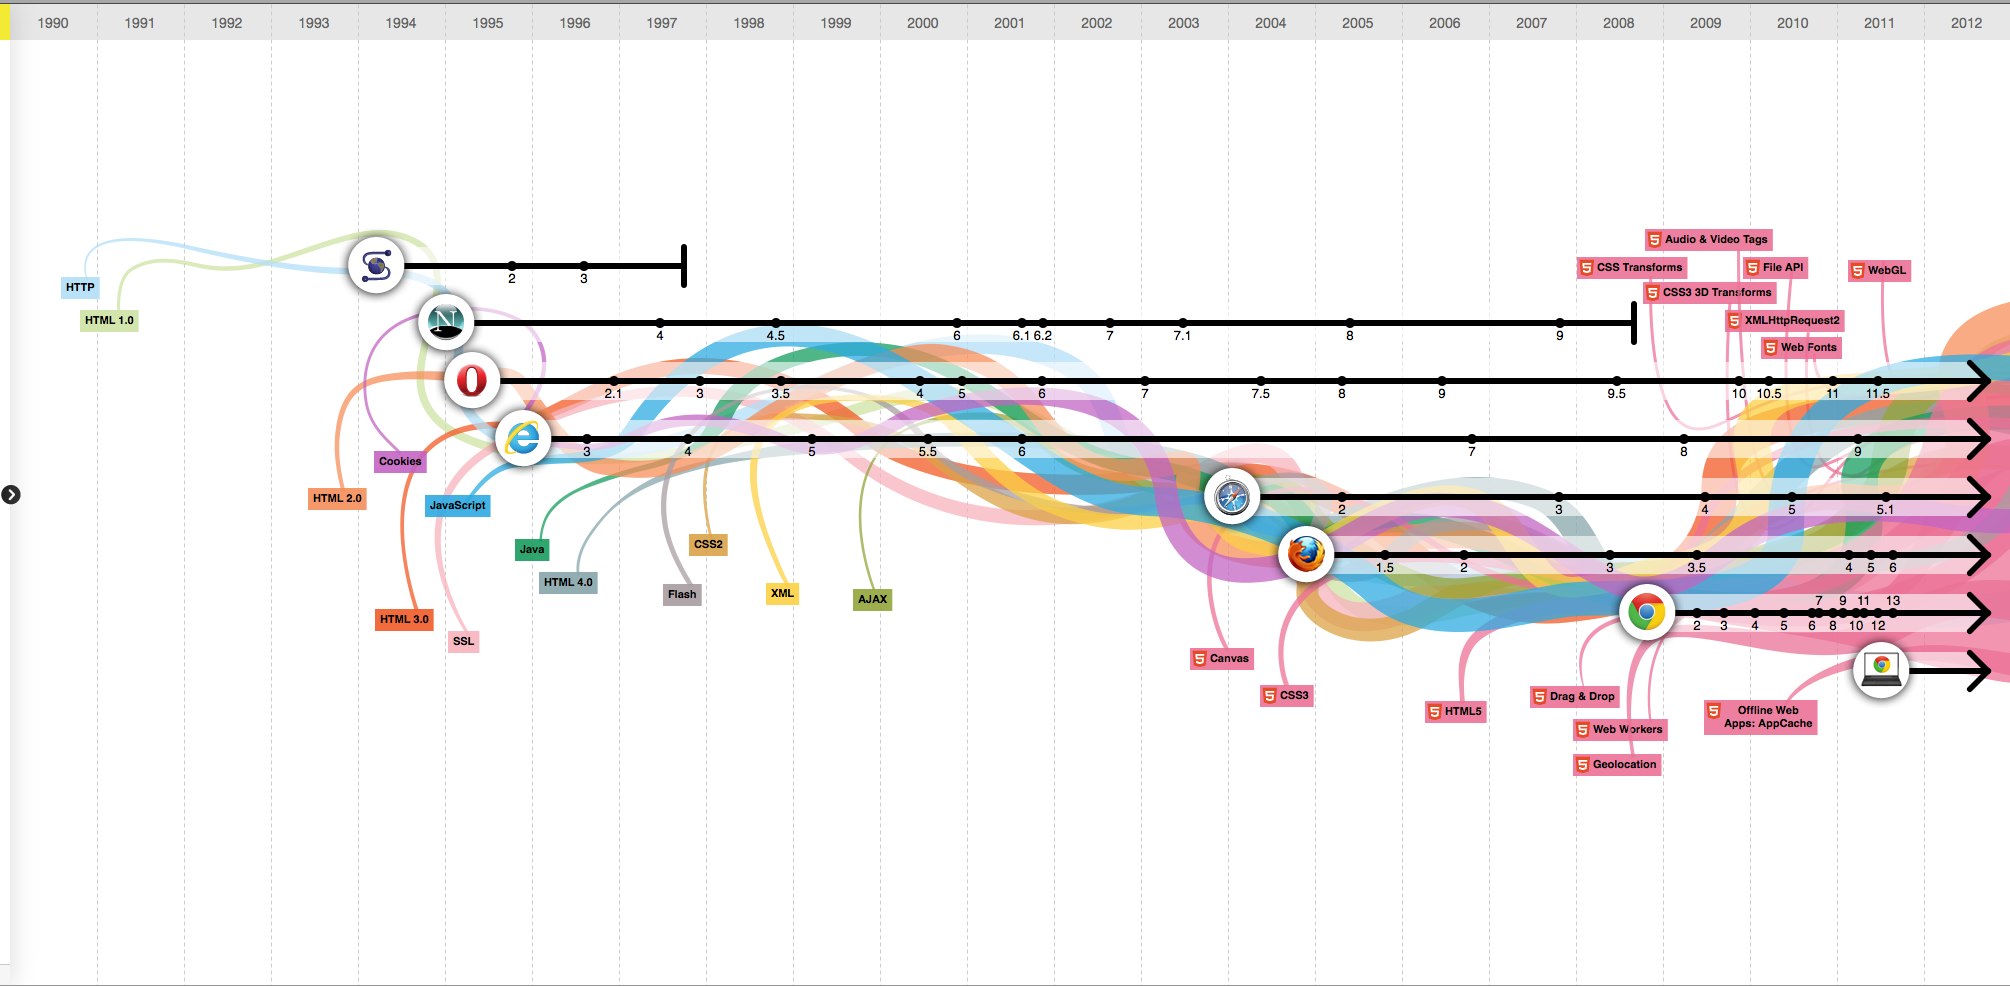
The Evolution of the Web is a cool, interactive visualization from the Google Chrome team (along with Hyperakt and Vizzuality) that explores the evolution of web browsers over the last 20 years.

Over time web technologies have evolved to give web developers the ability to create new generations of useful and immersive web experiences. Today’s web is a result of the ongoing efforts of an open web community that helps define these web technologies, like HTML5, CSS3 and WebGL and ensure that they’re supported in all web browsers.

The color bands in this visualization represent the interaction between web technologies and browsers, which brings to life the many powerful web apps that we use daily.

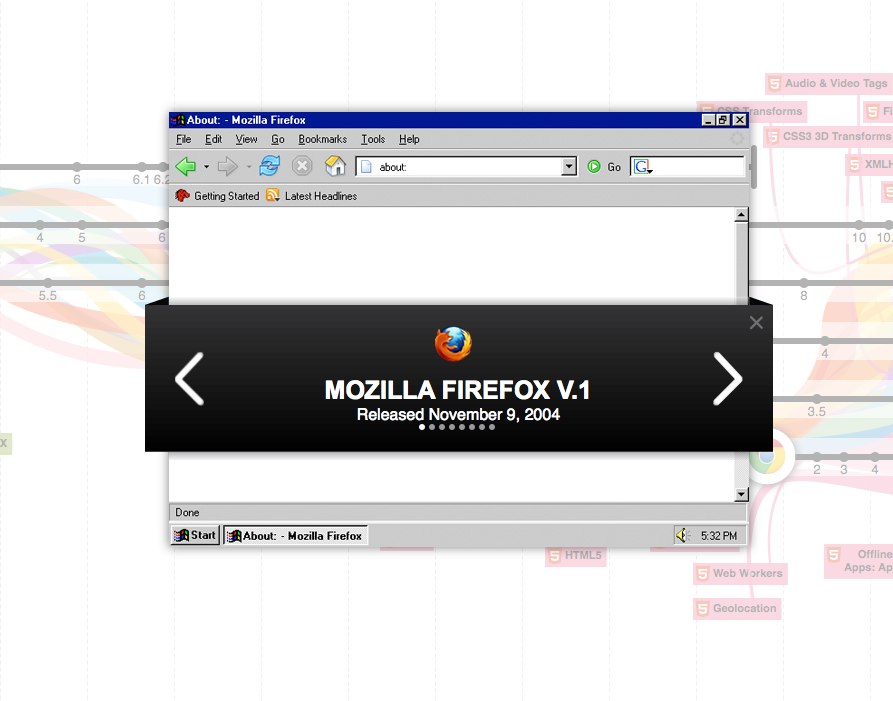
Clicking on any of the browser icons brings up a cool visual history of the window design for each version.

Although there is a lot of data showning the version releases along the timeline, part of this design is just pretty.  The flowing colored bands seems to grow bigger over time implying increased usage of each technology, but their placement behind the broser lines doesn’t actual show which technologies were used by each browser. 

In fact, there’s a subtle marketing spin that has all of the lines converging behind the Google Chrome logo in 2008 and then exploding into the future.  And the HTML5 line seems to imply that it will take over the Internet in 2012.

Found on Flowing Data.


Wednesday
Sep072011

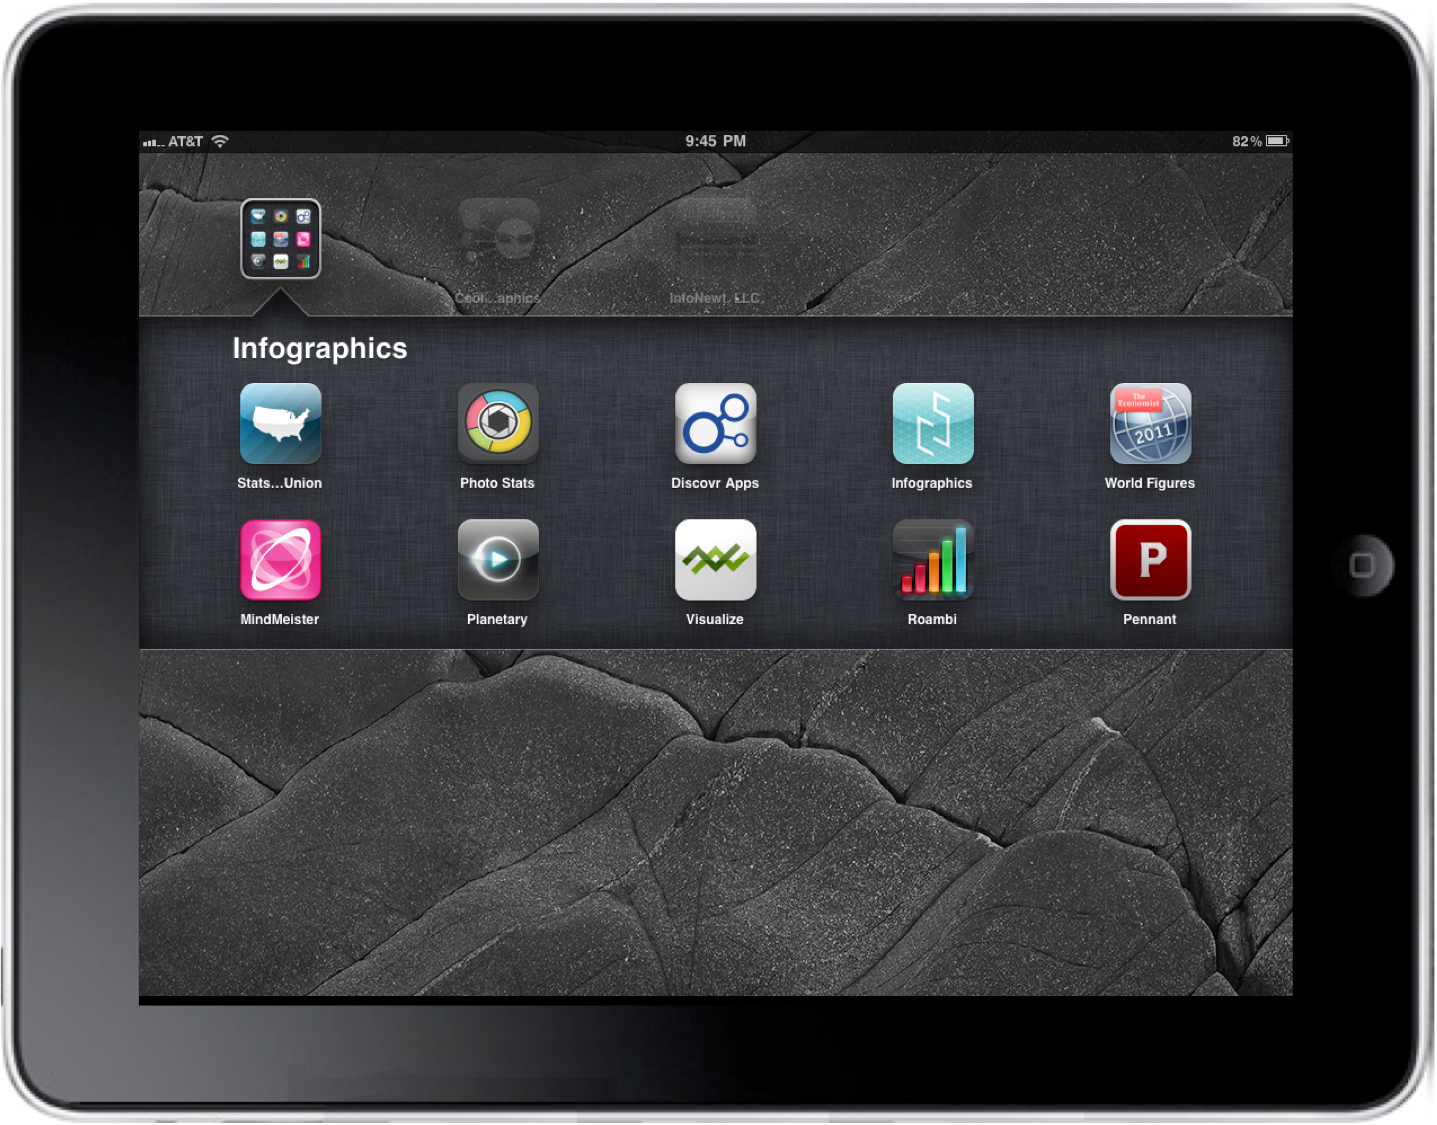
10 Infographics and Visualization Apps for iOS

As infographics continue to evolve and grow in popularity, so do the different ways we can view them.  A bunch of infographic specific apps have begun showing up on mobile devices. The functions of these apps include viewing world statistics, infographic design portfolios, company dashboards, creating mind maps, finding new apps and exploring your music collection visually.

Today we look at 10 Infographic Apps for iOS devices (in no particular order):


1. Stats of the Union  (FREE)

(iPad ONLY)

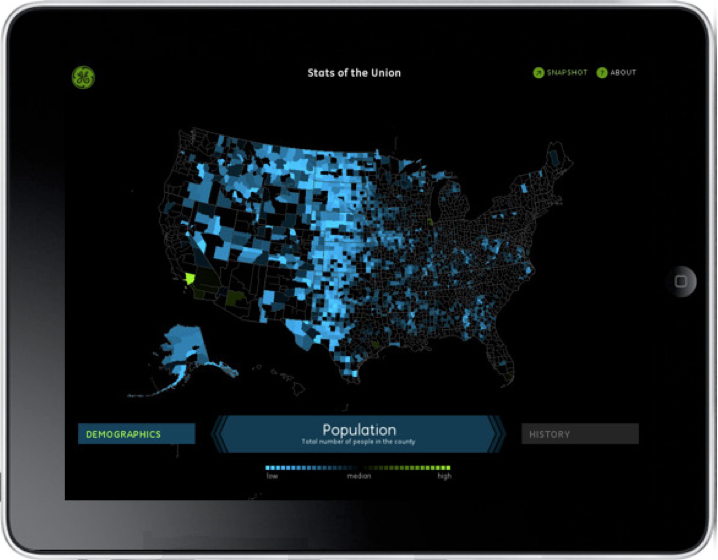
Stats of the Union is a data visualization app from Ben Fry, Fathom Information Design and GE.  Summarizing the census data by county, you can easily explore Births, Deaths, Diseases, Demographics, etc.

Explore the nation’s vital signsโ€•from life expectancy to access to medical careโ€•and make your own conclusions about America’s health. See a stat you’d like to share? Save it as a snapshot.

Stats of the Union is powered by the Community Health Status Indicators (CHSI) report, which consists of data from federal agencies including the Census Bureau, Department of Health & Human Services, Department of Labor and the Environmental Protection Agency.


2. Photo Stats ($0.99)

(iPhone, iPad and iPod Touch)

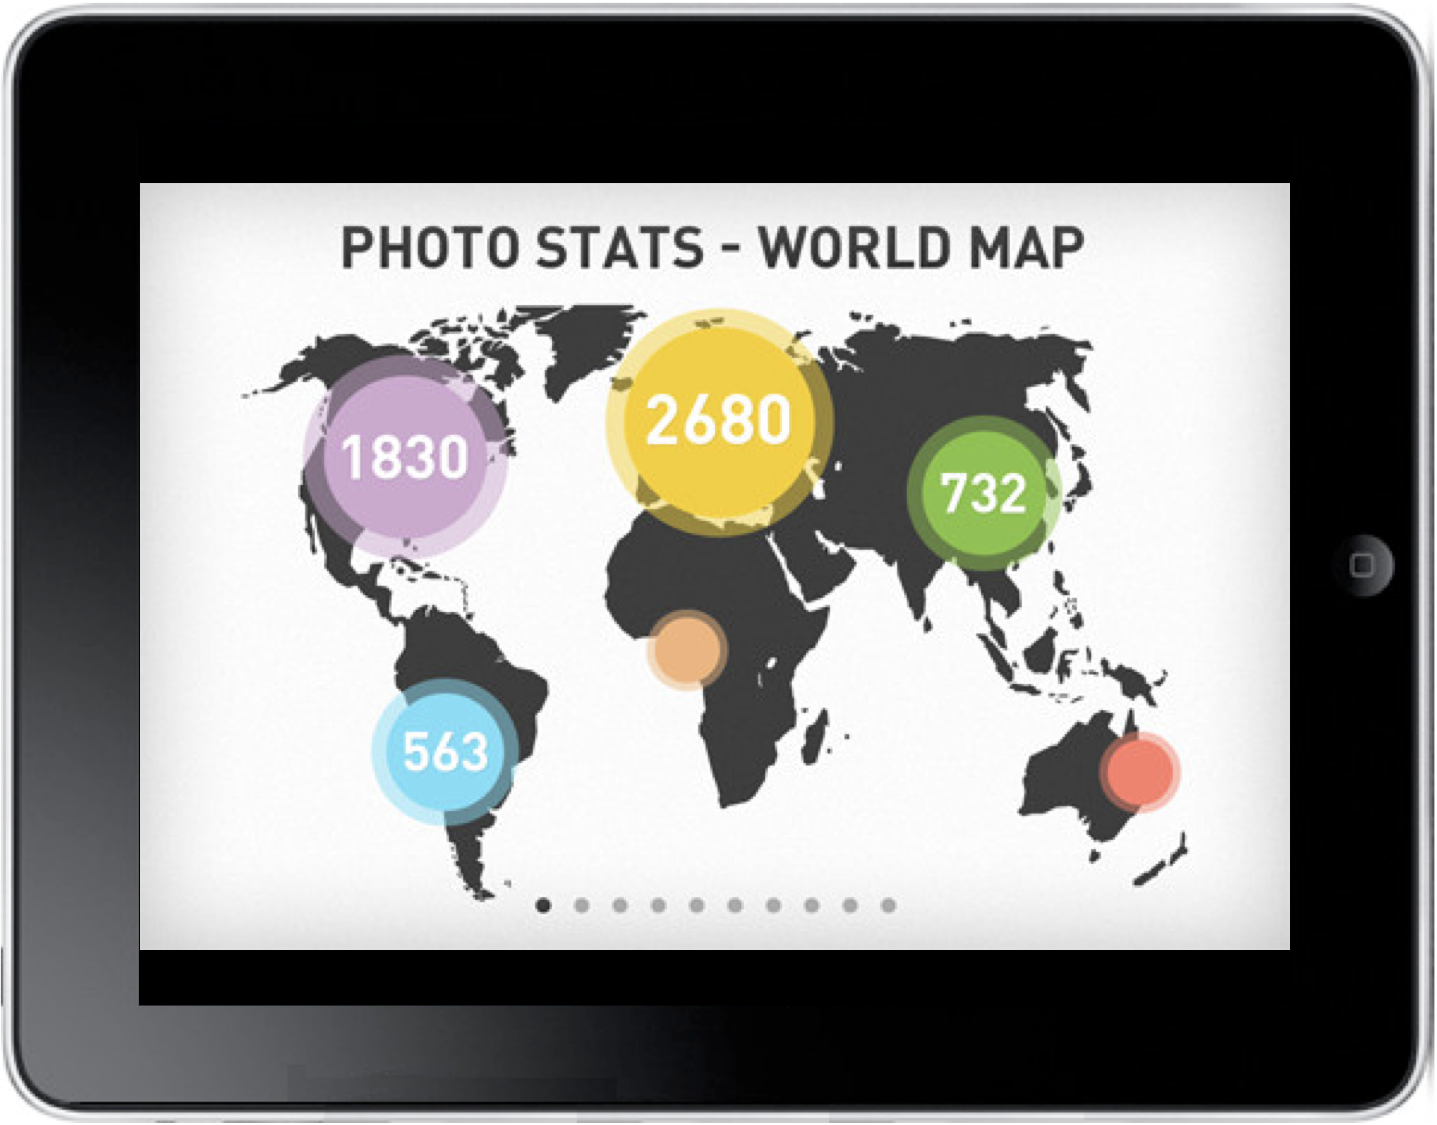
A very cool app from Dear Future Astronaut AB.  The Photo Stats app analyzes all of the photos on your iDevice and creates 11 different personal visualizations using the meta data of the photos.  Then, with the click of a button, it will combine these data visualizations into one cohesive infographic that you can save or post directly to Facebook or Twitter.

Create cool infographics about how, when and where you take photos on iPhone. Visualize your iPhoneography habits, learn how to make better photos and show off photo skills to your friends.


3. Discovr Apps ($0.99)

(iPhone, iPad and iPod Touch)

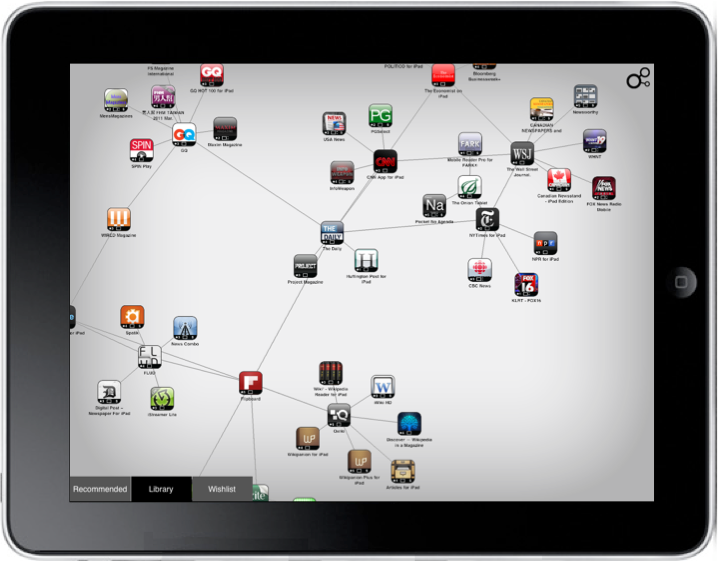
Discovr Apps is a great, interactive mind map of related iOS apps, and works as a discovery tool to find new apps.  Starting with one of your exisiting apps, the recommended apps or using the search, the app shows you related apps.  Tap any of the to expand the related apps, and continue to explore deeper into any app displayed on the screen.

The author, Jammbox, has applied this same exploration user interface to Music with Discovr Music ($1.99) to find similar music and artists.

Simply search for an app that you like or choose from one of our featured apps. We’ll show you how the apps you choose are connected in a massive, never-ending map of the App Store, and we’ll give you great recommendations for other apps to download. 

When you find an app you like you can read the app descriptions, check out the screenshots and ratings, or buy it directly from the App Store. You can also share your favorite apps and maps with your friends via Twitter, Facebook or email.


4. Infographics, by Column Five Media (FREE)

(iPhone, iPad and iPod Touch)

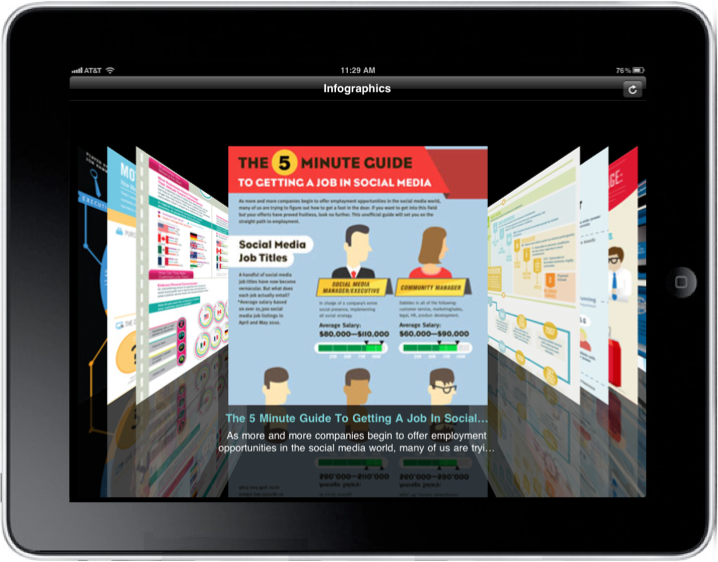
From the infographic design firm, Column Five Media, the Infographics app is a visual portfolio showcasing many of their designs.  I love the coverflow mode when you view the list in landscape.

We have really appreciated everyone who is staying connected through our Infographics newsletter, and we are happy to bring fresh infographics to you for the iPad and iPhone with our brand new Infographics app, which you can download for free. If you have a chance to check it out on an iPad, that is definitely the way to go for the best browsing experience, but the iPhone version will give you some mobile eye candy as well. This is version 1.0 and there are a lot of new features in the works along with a version for Droid coming soon.


5. The Economist World in Figures 2011 Edition ($0.99)

(iPhone, iPad and iPod Touch)

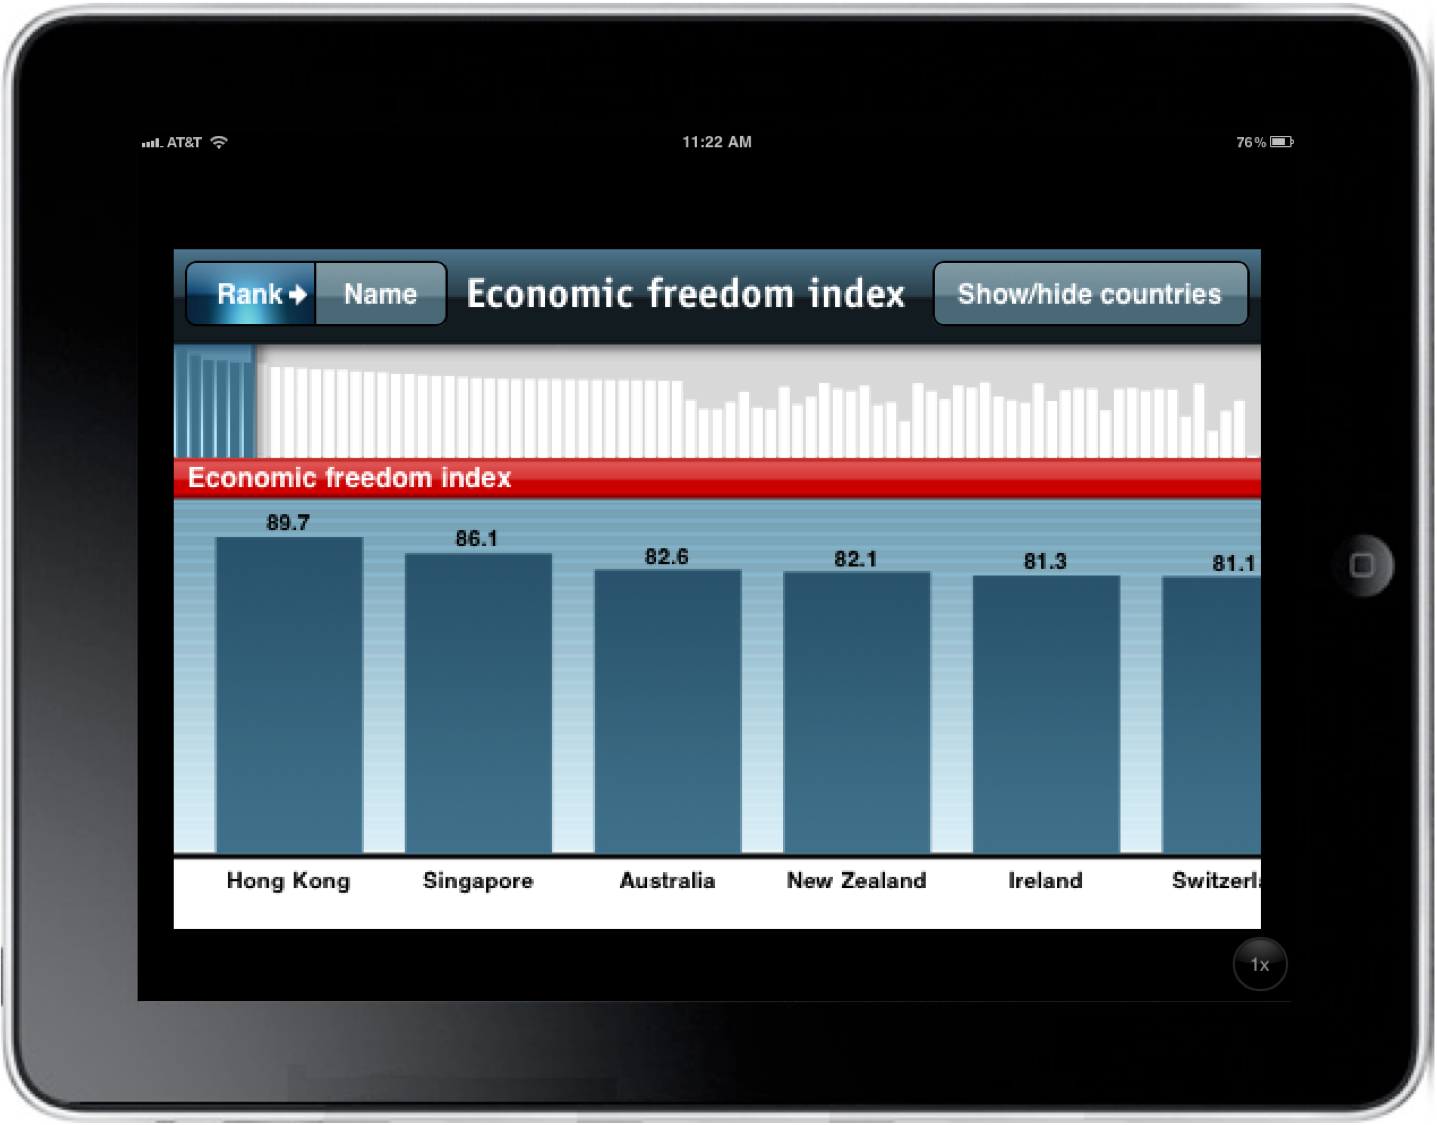
From a collaboration between The Economist and XPLANE | Dachis Group, comes The World in Figures 2011 Edition.  This app lets the user view global data and compare world statistics between countries.

“The process definitely challenged our designers, making us consider new ways to enhance functionality around how data was being presented, while also fostering intuitive interaction between the user and the application,” said Parker Lee, executive vice president, global account services, Dachis Group. “The end result really does put a new face on information.”


6. MindMeister for iPad ($7.99) or MindMeister for iPhone (FREE)

(iPhone, iPad and iPod Touch)

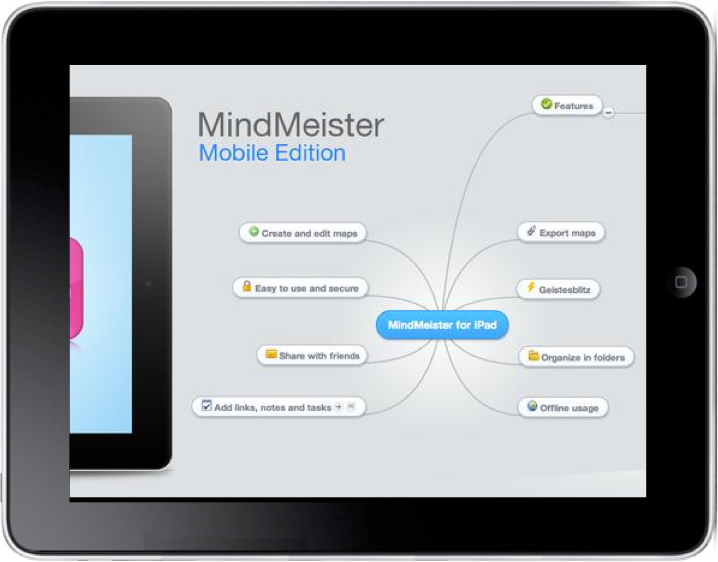
MindMeister started as an online mind mapping service that allows you to build, collaborate and share mind maps online.  With the iOS apps you can access your online maps and edit them from your mobile device.  Works with a free MindMeister account, but more features are available to members of MindMeisterPro.

Easily create, view and edit conceptual mind maps from this intuitive app, and then share them with friends and colleagues online. Automatic synchronization with the online MindMeister service ensures that your creations are with you wherever you go. This sync allows you to continue working on your ideas in our award-winning and full-featured web interface, on your own or together with your friends.


 7. Planetary (FREE)

(iPad ONLY)

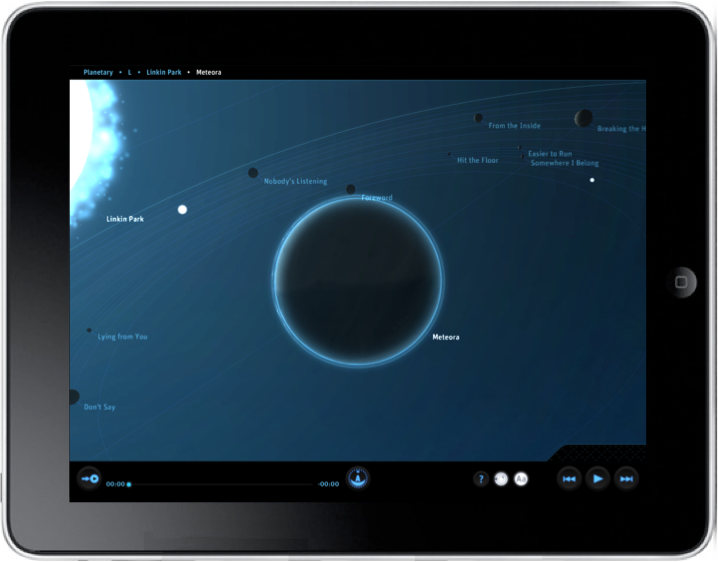
Planetary is a very cool app that visualizes your entire music library (as loaded on your iPad) as a galaxy.  Stars are artist, planets are albums and moon are individual tracks.  You can playback the tracks from the app, so it also makes a good visualizer.  They even did the calculations to base each moon’s speed on it’s track length, so when you play a song it lasts one complete orbit.  There a lot more behind the scenes information on the Bloom Blog.

Planetary is an all-new, stunningly beautiful way to explore your music collection, available only on iPad. Fly through a 3D universe dynamically created by information about the recording artists you love. Visit planets that represent your favorite albums and control the playback of your music on iPad by browsing and selecting astronomical objects.


8. Adobe SiteCatalyst Visualize (FREE*)

(iPad ONLY)

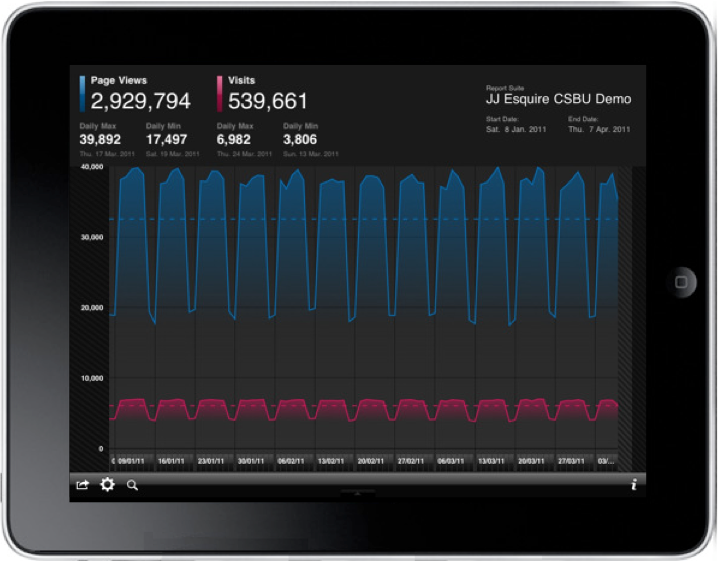
This only works if you are an existing Adobe SiteCatalyst customer (which isn’t free), but if you are, the Adobe SiteCatalyst Visualize app will allow you to explore your web stats in a handful of different, visual ways.

Adobe SiteCatalyst Visualize enables active data exploration via trend analysis of key metrics. Business analysts and marketers can use “multi-touch” capabilities to zoom and focus on specific data points within the last 90 days. In addition, using a visual “word cloud” of the most frequently selected metrics, marketers can easily add or change metrics to customize the presentation of data. Finally, marketers can easily share the analysis by sending report views via email or connecting to an external display for presentations.

*Please Note: You must be an existing Adobe SiteCatalyst customer with valid login privileges to use the application.


9. Roambi - Visualize (FREE)

(iPhone, iPad and iPod Touch)

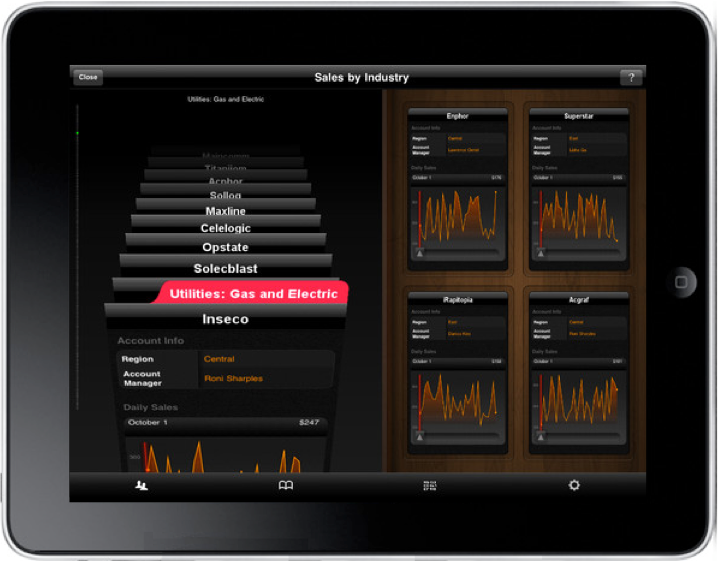
Roambi - Visualize is a mobile dashboard app that lets you explore different business reports and data visualizations.  You can view data from Microsoft Excel or CSV/HTML data sources for free, or there are a couple paid levels of the Roambi Publishing Service that offer many more data source options.

Roambi is an innovative app that quickly transforms your business reports and data – from many popular business applications – into secure, interactive mobile dashboards, instantly delivered to any iPhone or iPad. It lets you easily view and interact with up-to-the-minute company information – giving you the insight you need for on-the-go analysis, impromptu presentations and smart decision-making. Roambi puts the pulse of your business, in the palm of your hand.


 10. Pennant ($4.99)

(iPad ONLY)

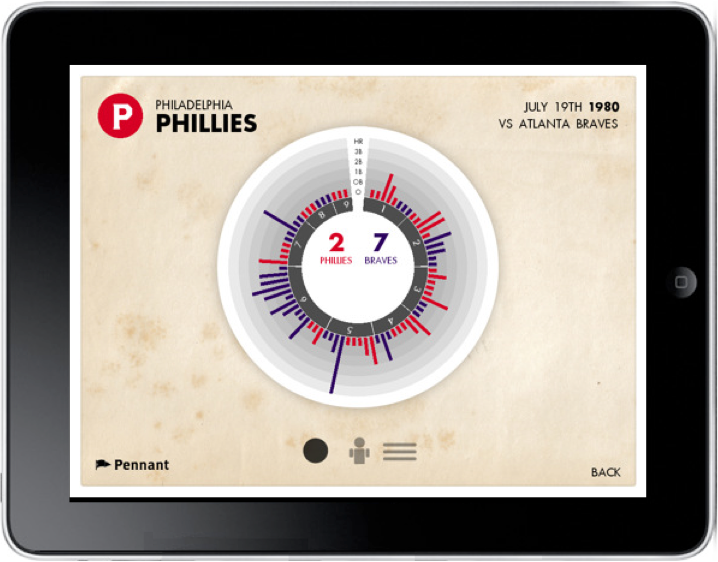
Pennant is a beautiful app that visualizes over 50 years of baseball history (from 1952-2010) with some beautiful visual designs.

Pennant is an interactive history of baseball like none other seen before. Using Pennant’s rich interface fans can browse and view data from over 115,000 games that have taken place from 1952 to 2010. For more info as well as a video preview please visit http://www.pennant.cc
 

Did I miss any that I should include in a future post?  This is absolutely only the beginning, so expect to see more in the future.

Wednesday
Jan192011

Client Infographic: An Illustrated View of SAP SPS 18 


The SPS 18 Fact Sheet is a new infographic InfoNewt (my company) designed recently for Panaya, a software-as-a-service company that provides upgrade automation to SAP customers.  The team at Panaya has some fantastic, proprietary data and needed a way to share that information with current and future customers.

It’s mind-boggling that the SAP Enterprise software is so big that the last round of updates had 13,349 notes/changes!  I can totally understand the need for Panaya’s simulations and analysis for IT managers trying to manage implementing these updates.  Panaya has a fantastic service that can evaluate the impact of each update package (support package stack) for their clients’ unique and different installations of SAP.

Every company uses (or doesn’t use) the SAP modules differently and knowing which modules have the most notes/changes can make a big difference on how you implement each update.  

SAP Support Package Stacks Have Never Looked so Sexy – An Illustrated View of SPS 18

SAP Support Package Stacks are “mega bundles” of software updates that SAP periodically makes available. These updates include important bug fixes, performance improvements, and legal changes such as labor and tax law changes. The challenge is that most stacks include well over 10,000 changes or “Notes.” And these changes can impact installations in ways that are hard to predict, with possible adverse effect on business processes.

One of the advantages of running a SaaS solution here at Panaya is that we can run aggregate analysis across hundreds of projects. Think “Google Trends” for SAP Support Package Stacks. We ran our simulation over hundreds of different instances to determine the typical impact areas and other stats. The goal is to help you plan towards your implementations.

We sent an early version to several thousands of reviewers and got great feedback.

As a next step, we partnered with designer Randy Krum, who, believe it or not, is not only a talented artist, but also a former SAP BPX-er. So he can actually pronounce ABAP and can tell BI from FI.

So without further ado, here’s SAP Support Pack 18 like you have never seen it before

Thanks to Udi and the rest of the team at Panaya!  There’s much more information available at Panayainc.com and ERP Executive: The Magazine for SAP Managers.

Tuesday
Oct052010

The Darwinian Evolution of Microsoft Windows


This is a cool infographic timeline, showing the Darwinian Evolution of Microsoft Windows from version 1.0 in 1985 up through the current Windows 7 in 2009.  Although it makes for a really tall infographic, I love seeing the visuals of the startup screens and the desktops.

Art is credited to Richard Cavolo, and the project is from TestKing.com (even though I can find no mention of it on their site).  It was posted on BitsandPieces.us

Thursday
Jun242010

Adobe Actionscript 3.0 Poster Viewer

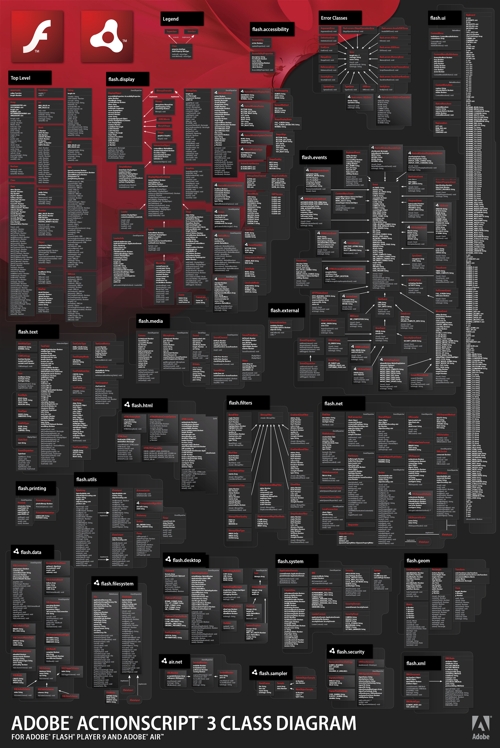
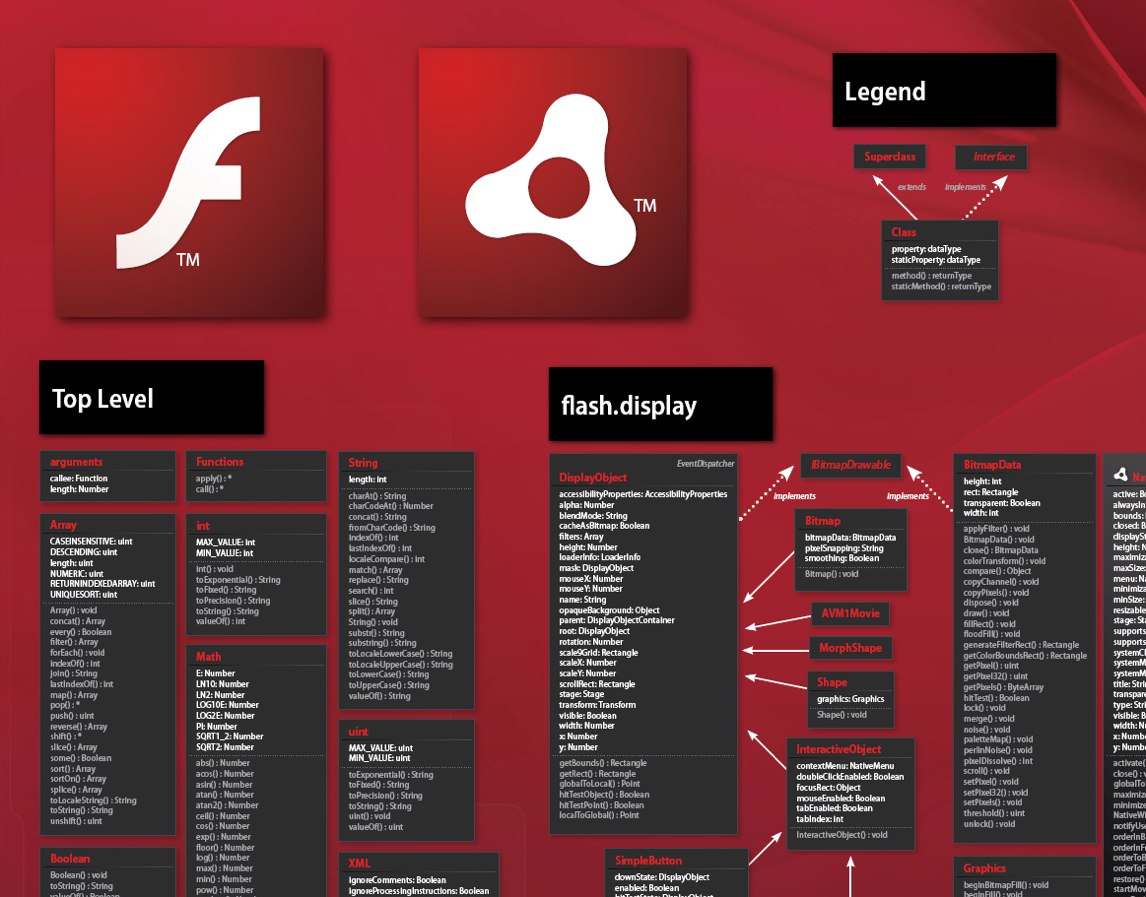
Adobe has published posters like this one before for registered users of their different software packages.  Now you can download the ActionScript 3.0 Diagram Viewer, a zoomable version using Adobe AIR.  This can keep a stand-alone viewer on your desktop (or 2nd monitor) as a reference when you need it.  For some developers, this may be easier than viewing the high-resolution JPG.

With the excellent feature from Zoomify, and the nicely laid out AS 3.0 posters, you are able to zoom and navigate through the entire Flash and Adobe® AIR™ ActionScript 3.0 API.

The AIR app was designed by ShaneHoffa.

Thanks to Julz for the link!

Wednesday
May192010

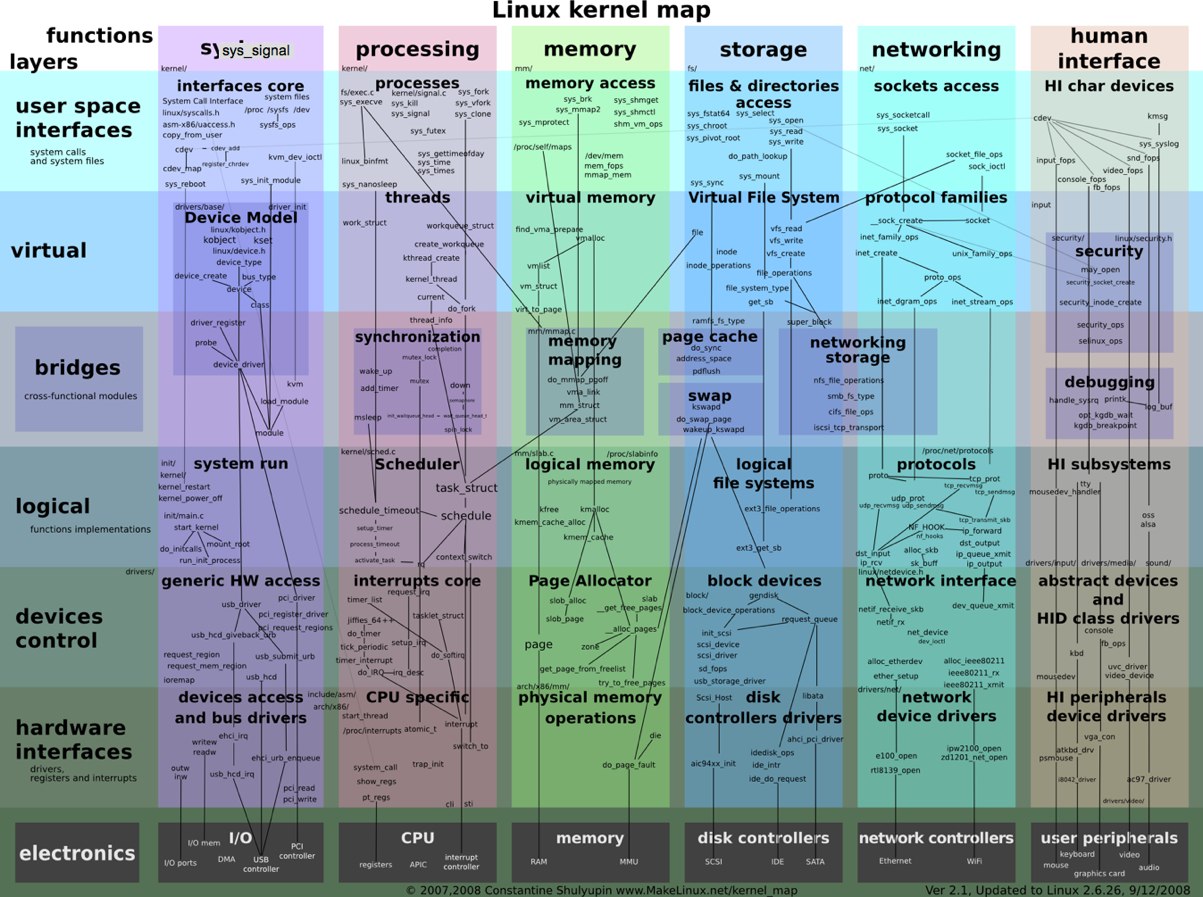
Linux Kernel Zoomable Map

Zoomable map of the open source Linux operating system kernel.  Designed by Constantine Shulyupin.

The Linux Kernel is one of the most complex open source projects. There are a lot of books, however it is still a difficult subject to comprehend. The Interactive map of Linux Kernel gives you a top-down view of the Kernel.

You can see most important layers, functionalities, modules, functions and calls. You can zoom in and drag around to see details. Each item on the map is a hypertext link to source code or documentation.

Thanks to Tobias for sending in the link!

Thursday
Feb182010

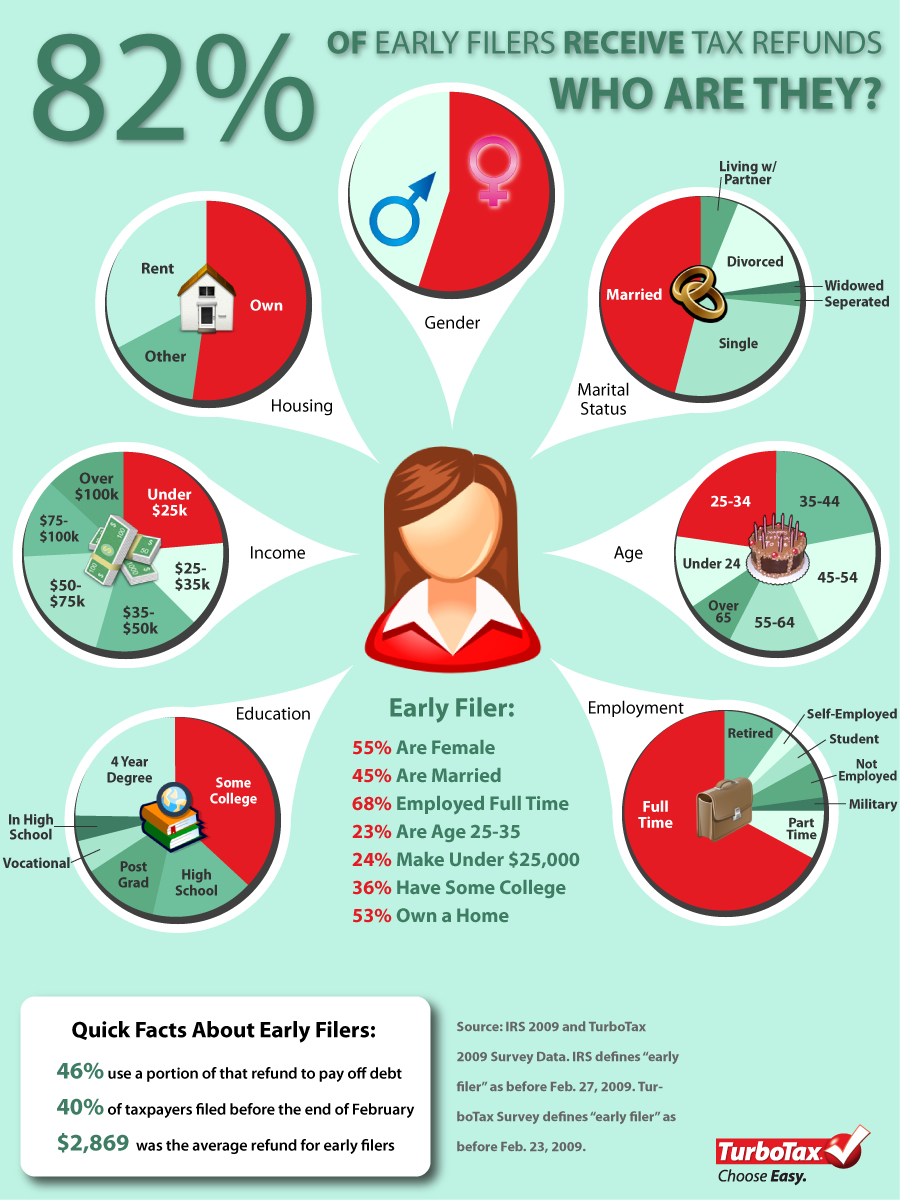
Early-Bird Taxpayers Get the Refund - infographic

$2,869 was the average refund for early filers in 2009 based on this infographic from TurboTax.  Designed by Column Five Media for Intuit.

Are you an early bird or a tax procrastinator? Did you know that people who file their income tax returns in February are among the most likely to get refunds – and larger ones at that?  TurboTax reports that 82% of taxpayers who filed before the end of February last year got money back, and on average, the refund for early filers is typically larger: $2,869 compared to $2,753 for returns filed through April 15th last year.


Forty percent of all tax returns last year were filed before the end of February. That means 60% missed out on some of the benefits of filing early such as putting money in your pocket faster – making your refund work for you.

Although I’m not a fan of the overuse of pie charts, I think it works in this case.  The infographic doesn’t have so many pie charts that it becomes confusing, so its very easy to wrap your head around who this typical TurboTax, early-filier consumer is.

Thanks Laura for the link!

Thursday
Feb112010

Tableau launches FREE Tableau Public today!


Today, Tableau Software launched a data visualization package for websites called Tableau Public.  This package is intended to be used be anyone with a website to embed visualizations on their own sites.

Tableau Software today launched a new product that brings public data to life on the web. Tableau Public, available for free, lets anyone who posts content to the web easily create interactive visualizations and publish them to blogs, web sites, Twitter feeds or anywhere online. Instead of viewing static charts or tables, Tableau Public lets people answer questions and share data interactively on the web. 

The visual above was created using Tableau Public to demonstrate its capabilities, but you’ll notice that I’ve been able to embed it here on Cool Infographics as well.  The visualizations created allow users to share, embed and link to your graphics from anywhere…making them social!

They’re also interactive and linked together.  For example, click on the Bronx in the data above, and all of the visuals will highlight just data related to the Bronx.  The map even adjusts to only focus on the Bronx.

About the NY City Graffiti visual:

Looking borough by precinct across The Big Apple, one can quickly see that there are some differences in how graffiti is handled. For instance, Staten Island has very little graffiti, but the graffiti they do have lingers without cleanup for almost twice the citywide average. On the other side of the spectrum, Manhattan has over 2000 incidents of graffiti, but it is cleaned up in less than 17 days on average.

Look for more features from Tableua Public here in the future as I experiement and play with it.

Thanks to Elissa at Tableau Software for the link and information!


EDIT:  Here’s a news video as part of the announcement.  Thanks Adriana!