About
Randy Krum
President of InfoNewt.
Data Visualization and Infographic Design

Infographic Design

Infographics Design | Presentations
Consulting | Data Visualizations

DFW DataViz Meetup

Join the DFW Data Visualization and Infographics Meetup Group if you're in the Dallas/Fort Worth area!

Search the Cool Infographics site

Custom Search

Subscriptions:


Feedburner

The Cool Infographics® Gallery:

How to add the
Cool Infographics button to your:

Cool Infographics iOS icon

- iPhone
- iPad
- iPod Touch


Read on Flipboard for iPad and iPhone

Featured in the Tech & Science category

Flipboard icon

Twitter Feed
From the Bookstore

Caffeine Poster

The Caffeine Poster infographic

« The Foursquare Visualizer | Main | Connecting The Dots »
Friday
May032013

Subways of North America

Subways of North America infographic

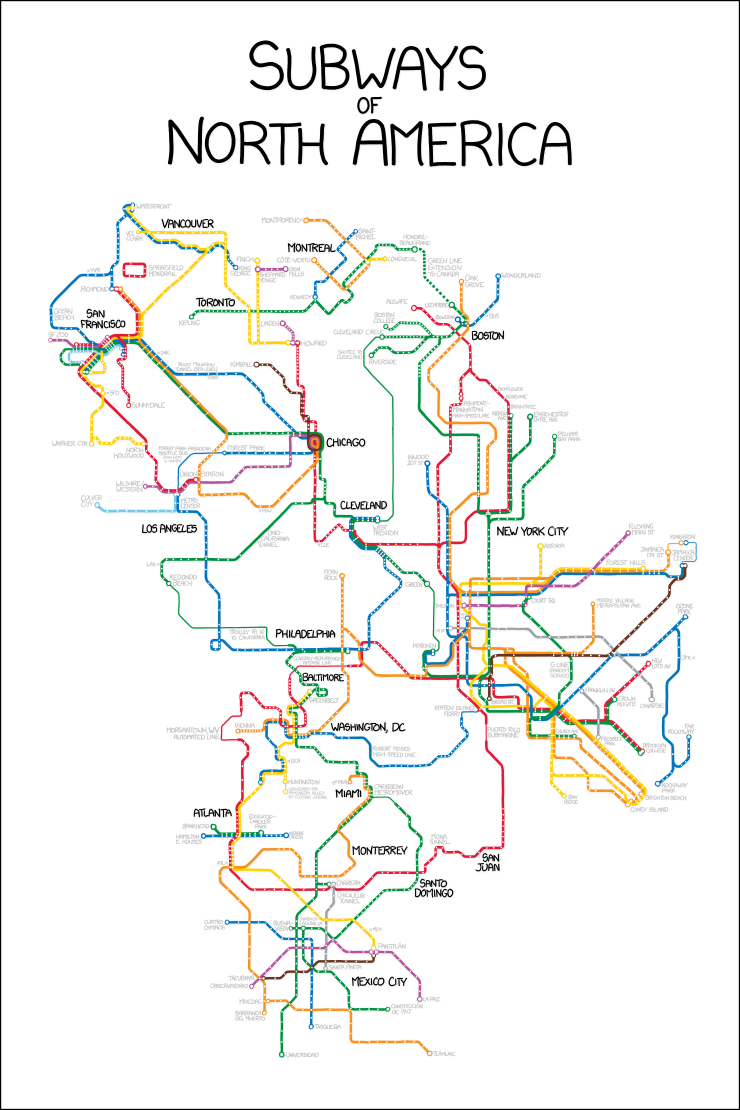
Now this is truly meta.  A subway map visualization of all the Subways of North America from Randall Monroe of xkcd.com.

For the pedantic rail enthusiasts, the definition of a subway used here is, with some caveats, “a network containing high capacity grade-separated passenger rail transit lines which run frequently, serve an urban core, and are underground or elevated for at least part of their downtown route.” For the rest of you, the definition is “an underground train in a city.”

About one in three subways stops in North America are in NYC

Another great design from Randall!

PrintView Printer Friendly Version

EmailEmail Article to Friend

Reader Comments

There are no comments for this journal entry. To create a new comment, use the form below.
Editor Permission Required
While we are migrating to a new site design, you must have editing permission for this entry in order to post comments.