About
Randy Krum
President of InfoNewt.
Data Visualization and Infographic Design

Infographic Design

Infographics Design | Presentations
Consulting | Data Visualizations

DFW DataViz Meetup

Join the DFW Data Visualization and Infographics Meetup Group if you're in the Dallas/Fort Worth area!

Search the Cool Infographics site

Custom Search

Subscriptions:


Feedburner

The Cool Infographics® Gallery:

How to add the
Cool Infographics button to your:

Cool Infographics iOS icon

- iPhone
- iPad
- iPod Touch


Read on Flipboard for iPad and iPhone

Featured in the Tech & Science category

Flipboard icon

Twitter Feed
From the Bookstore

Caffeine Poster

The Caffeine Poster infographic

« Visualizing the School of Design | Main | Subways of North America »
Friday
May032013

The Foursquare Visualizer

The Foursquare Visualizer interactive infographic

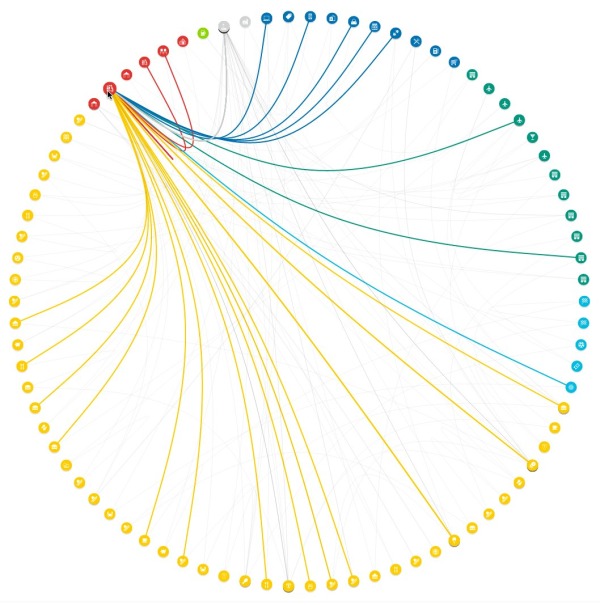
Foursquare has release a new Foursquare Visualizer, that creates an interactive data visualization of your own activity for the last 12 months.  I included the images from my own history.

At Foursquare, we’ve always known how very special our community is. Today, April 16 (4/4^2), marks the fourth annual 4sqDay. Each year, we take this opportunity to thank our amazing community for all that they do.

…take a peek back into your own history at foursquare.com/visualizeme. It’s just our small way of saying, “Thanks! We think you’re awesome.”

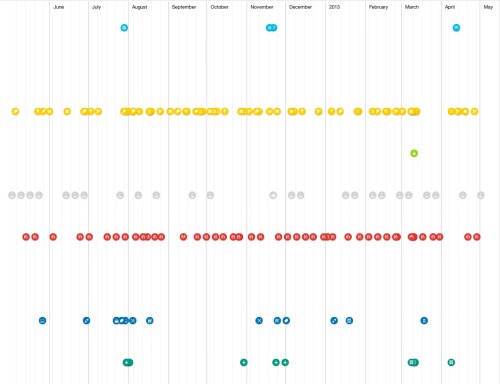
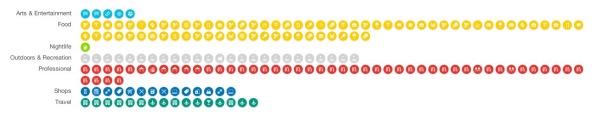
There are a handful of different visualizations of your own history of check-ins available.  The connection circle (shown above) is the best looking.  Other visuals include a Timeline and Categories.

Found on the Foursquare blog


PrintView Printer Friendly Version

EmailEmail Article to Friend

Reader Comments

There are no comments for this journal entry. To create a new comment, use the form below.
Editor Permission Required
While we are migrating to a new site design, you must have editing permission for this entry in order to post comments.