The Foursquare Visualizer
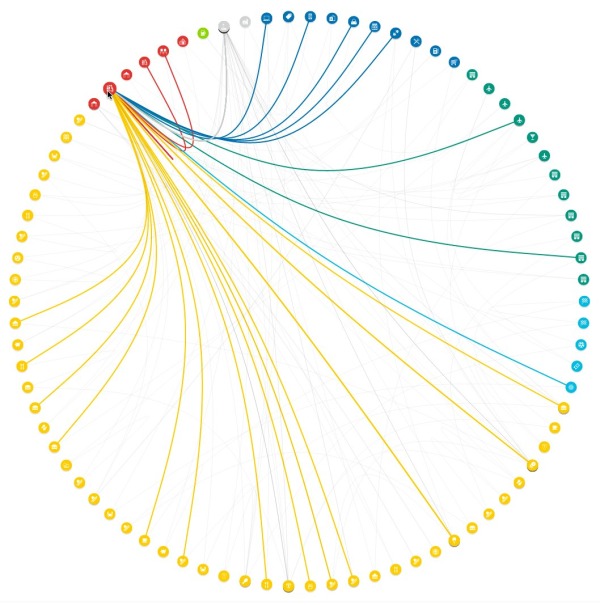
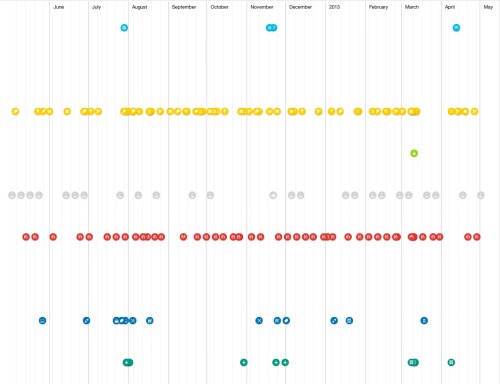
Foursquare has release a new Foursquare Visualizer, that creates an interactive data visualization of your own activity for the last 12 months. I included the images from my own history.
At Foursquare, we’ve always known how very special our community is. Today, April 16 (4/4^2), marks the fourth annual 4sqDay. Each year, we take this opportunity to thank our amazing community for all that they do.
…take a peek back into your own history at foursquare.com/visualizeme. It’s just our small way of saying, “Thanks! We think you’re awesome.”
There are a handful of different visualizations of your own history of check-ins available. The connection circle (shown above) is the best looking. Other visuals include a Timeline and Categories.
Found on the Foursquare blog
 Foursquare,
  Location,
  history,
  interactive,
  social,
  timeline


