About
Randy Krum
President of InfoNewt.
Data Visualization and Infographic Design

Infographic Design

Infographics Design | Presentations
Consulting | Data Visualizations

DFW DataViz Meetup

Join the DFW Data Visualization and Infographics Meetup Group if you're in the Dallas/Fort Worth area!

Search the Cool Infographics site

Custom Search

Subscriptions:


Feedburner

The Cool Infographics® Gallery:

How to add the
Cool Infographics button to your:

Cool Infographics iOS icon

- iPhone
- iPad
- iPod Touch


Read on Flipboard for iPad and iPhone

Featured in the Tech & Science category

Flipboard icon

Twitter Feed
From the Bookstore

Caffeine Poster

The Caffeine Poster infographic

Entries in social media (74)

Monday
Oct042010

SoTech Infographic v1.0 - your feedback requested

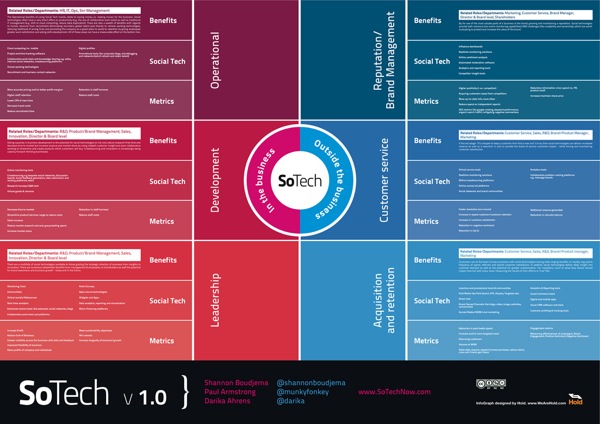
The SoTech Infographic v1.0 was released during the Social Collective 2010 Conference in London last week as a visual way to show how social networks interact with the different functions of business.  The infographic was created by Hold, a Brighton based graphic design studio.

Introduced at Social Collective, Darika Ahrens, Shannon Boudjema + Paul Armstrong presented an infographic (created by http://www.wearehold.com) that demonstrates how social technologies work within a business + outside a business - 

The infographic is available in a number of formats, like PDF and JPG, Scribd and Slideshare.  An online copy of the presentation from the conference is below (using Prezi, a great visual presentation tool!).  I agree with their thoughts on using infographics as a conference tool as well.


Both on the SoTech Now website, and the email I got from Paul Armstrong, is the invitation to heavily critique this v1.0 of the infographic.  They would like to develop and release v2.0, but are looking to incorporate all of the feedback they can get.  Leave comments below or on the SoTechNow site with your own reactions.

Here are some of my initial thoughts (mainly on the design):

  • Very text heavy.
  • Readability is low.  I’m a fan of big infographics that allow you to zoom in and dig deeper into the details, but in this version, by the time you zoom in close enough the read the text, you’re too close to understand the context.
  • Use icons, at least for the different business functions
  • Show examples of sites in each of the “Social Tech” sections.  Otherwise it seems like wishful thinking that there is a product that successfully does each of these functions.
  • Show examples of the metrics.  Are these actually quantifiable?

I think the infographic does provide a great framework to either develop a social plan, or to evaluate an existing plan.  It would be fascinating to review a company’s efforts using this framework as an example of social media being used successfully (or not) by a corporation.

What do you think?

Thursday
Sep092010

The Web 2.0 Points of Control Map


The Web 2.0 Summit Points of Control Map is a very cool, interactive map.  As part of the marketing for the upcoming Web 2.0 Summit (November 15-17 in San Francisco) they have released this interactive map that takes the metaphor of web companies/brands as countries on a map (from xkcd.com and flowtown.com) to a new level.

Pan and Zoom to explore the map, and click the icons to get some insight about each player and their position.

Then, turn on the comments view to discuss the map with others and add your own ideas!


By clicking on any of the company icons at the top, arrows are shown to indicate the business areas (continents) that the companies are trying to expand into (colonize).  You can turn them on one at a time, or turn many of them on at the same time.

Additionally, you can select any individual icon to get more details:

John Battelle has an in-depth post on the Web 2.0 Summit blog, Points of Control: The Map, about the creation of the map, and his hope that others will add to it in the future.

We’ve put the entire map under a Creative Commons Attribution-NonCommercial-ShareAlike 3.0 Unported License, which means we want you to take this idea and add to it, making it better. Once our amazing development partners at Blend Interactive catch their breath, we also plan to release the code and documentation, so you can create your own maps as well.

Our thanks to the team at Blend who worked with me to bring this vision to reality, and to Janetti Chon, my producer, who kept it on track, and the entire team at Web 2.0 for bearing with us as we brought this first iteration to fruition.

Found on VizWorld.com and VizThink.com 

Friday
Sep032010

The 2010 Social Networking Map


The team at Flowtown.com designed the 2010 Social Networking Map as an update to the Map of Online Communities by xkcd.com in early 2007.  Social networking has certainly advanced in the last three years (even in the last three days!), so the update shows a lot of changes in geography.

It does seem a little premature to claim this is the map of social media for 2010 with five months left to go.  A lot can happen in five months (like the Apple PING service announced this week).

Tuesday
May042010

A HubSpotter's Guide to the (Social Media) Galaxy

I love this humorous Star Trek parody take on how to man your Marketing crew to be prepared to explore the (social media) galaxy!  From HubSpot.com, A HubSpotter’s Guide to the Galaxy is an infographic designed by our friend Mike Wirth.

Sometimes marketing seems like a cosmic adventure through social media, the blogosphere and other new, unknown regions of the internet!  Here’s how HubSpot imagines businesses traversing through the galaxy to meet new beings, engage with them and exchange new ideas!

Mike, where’s the holodeck so we can interact with infographics???


Page 1 ... 4 5 6 7 8